
Activation is often measured at the point instrumentation becomes convenient: account created, profile completed, checklist dismissed. Those events describe setup. They do not prove that the user received value.
A useful activation metric marks the first product outcome that gives a new user a reason to continue. It should occur early enough to improve onboarding and be meaningful enough to relate to later use.
That balance is the hard part. Pick an event too early and nearly everyone “activates” without adopting the product. Pick one too late and the team waits weeks to learn whether onboarding worked.
Write the value exchange first
Before choosing an event, finish this sentence:
A new user gives us ______ and receives ______ in return.
For a session replay product, the user installs an SDK and receives the first useful recording. For a design tool, the user creates something and successfully shares or exports it. For a team workspace, the first value may require another person to join and participate.
The activation event should sit on the “receives” side. Installation, data entry, and permissions are costs the user pays on the way there.
Use a metric stack instead of one magic event
One activation rate cannot explain why users did or did not reach value. Keep a small metric stack:
| Metric | Question |
|---|---|
| Eligible new users | Who had a fair chance to activate? |
| Activation rate | What share reached the defined value state? |
| Time to value | How long did activation take? |
| Required-step completion | Which prerequisite lost users? |
| Activation quality | Did the first result contain enough value to matter? |
| Early return or repeat action | Did users come back and use the value again? |
Activation quality prevents the metric from being gamed. A user can create an empty dashboard, import unusable data, or complete a tutorial without a meaningful result.
Define a minimum quality threshold where the product allows it: the first recording is playable, the first report contains data, or the first invited collaborator completes a shared action.
Calculate the activation rate with an eligible denominator
activation rate = users reaching activation / eligible new usersEligibility needs a written rule. Exclude test accounts, staff, obvious abuse, and users who could not access the feature because of a known business restriction. Do not quietly remove users who encountered product errors; they are part of the experience being measured.
Choose a measurement window that matches the product. A consumer app may expect value in one session. A developer tool may require an integration and data arrival. Report both eventual activation and activation within a target window when speed matters.
Measure time to value as a distribution
An average time to value can hide two populations: users who activate immediately and users who struggle for days.
Track median, p75, and p90 time to value. Then break the tail down by onboarding transition, platform, role, device, and release.
Long time to value is not automatically friction. The user may need a teammate, approval, or external data. Record waiting states where possible so the team does not “optimize” a necessary business process.
The useful question is: What part of the time was unavoidable, and what part came from uncertainty, retries, failure, or missing feedback?
Test whether the activation definition predicts continued use
An activation event is a hypothesis. Validate it against a later outcome such as meaningful return, repeated core action, subscription continuation, or retention appropriate to the product.
Compare cohorts: users who reached activation quickly; users who reached activation slowly; users who completed onboarding but did not activate; users who activated through an alternate path; and users who never activated.
If activated and non-activated users retain at the same rate, the event may be too shallow. If only power users can reach it, the event may be too late.
Correlation does not prove the event caused retention. The purpose is to find an early, useful marker—not to make a causal claim the data cannot support.
Find false activation
False activation occurs when the analytics event fires but the user does not experience the promised result.
Common examples: the client emits integration_connected before the backend verifies it; a project is created with no usable content; an invitation is sent to an invalid or blocked address; a payment event fires before order or entitlement creation; and A tutorial completion event fires when the user skips it.
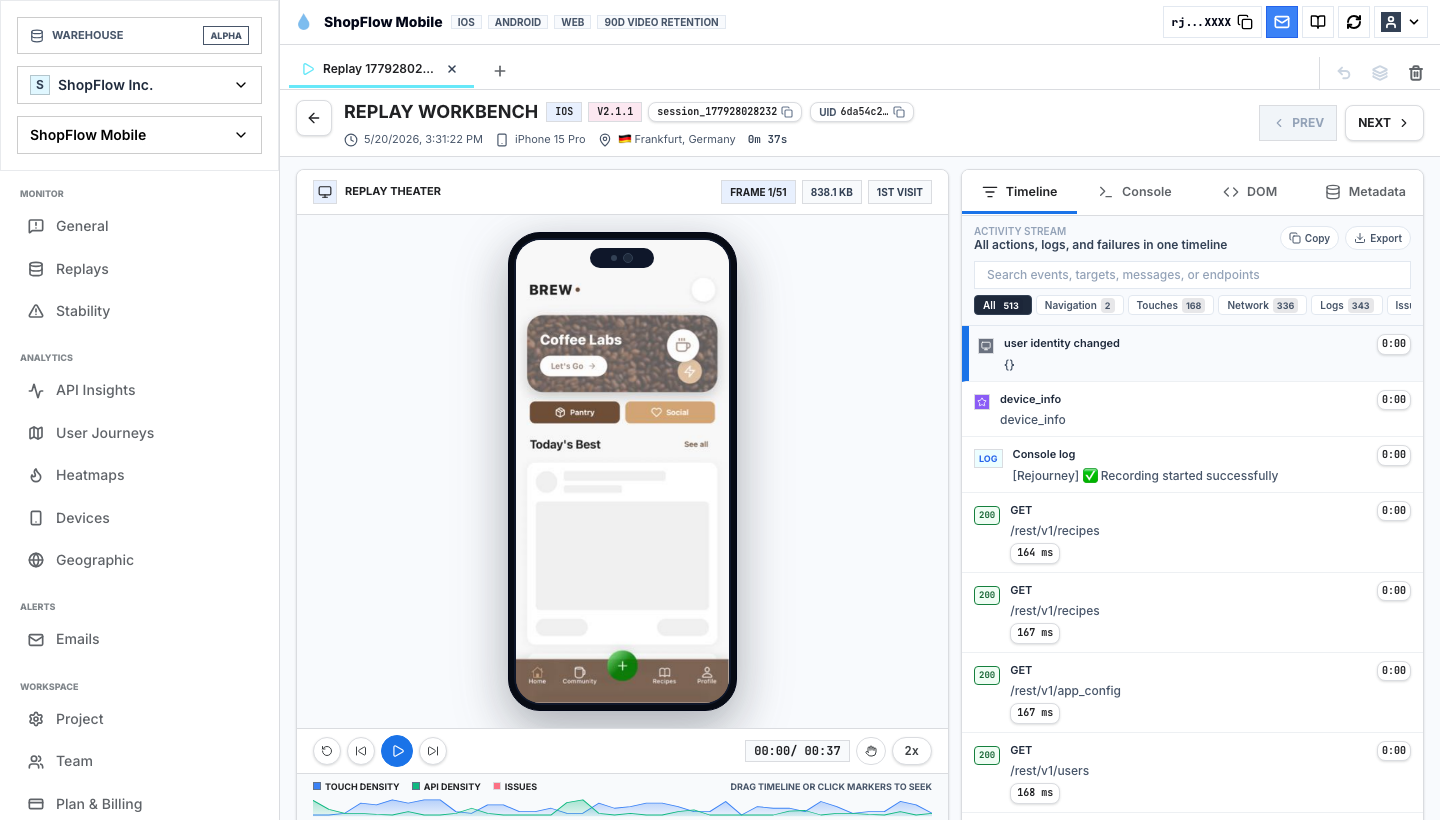
Audit activated sessions with replay and server state. Look for users who technically crossed the threshold but immediately repeated setup, navigated back, opened help, encountered an error, or disappeared.
False activation inflates acquisition quality and makes later churn appear mysterious.
Diagnose activation by comparing paths
A single funnel assumes one route to value. Journey analytics can reveal that successful users branch around the designed onboarding or that failed users loop through settings, permissions, and help.
Compare healthy and degraded paths: Which screens or routes appear only before successful activation? Where do failed users backtrack? Which prerequisite consumes the most time? Do failures concentrate after one release or on one device? Does a slow or failed request interrupt the value moment?
The answer may be to remove a step, but it may also be to move an explanation earlier, fix a backend dependency, preserve state, or support a successful alternate path.
Use guardrails when optimizing activation
A higher activation rate can be misleading if the team weakens the definition, auto-completes setup, or pushes users through a flow they do not understand.
Keep guardrails beside the primary metric: repeat core action; day-appropriate return or retention; support contacts during onboarding; error and crash rate; refund, downgrade, or early cancellation; and data quality or setup completeness.
The objective is not the most people crossing a line. It is more eligible users receiving durable value with less unnecessary effort.
A practical activation review
Each week, answer five questions:
- Did activation rate or time to value change?
- Which prerequisite transition explains the most excess loss or delay?
- Is the change concentrated by release, platform, device, role, or acquisition source?
- What differs between successful and failed sessions?
- Did activation continue to predict the downstream outcome?
Write the finding in product language. “Activation fell 6%” is a report. “New account owners on mobile reach integration setup but cannot see the success state after returning from authentication” is a decision.
Open the sessions behind activation
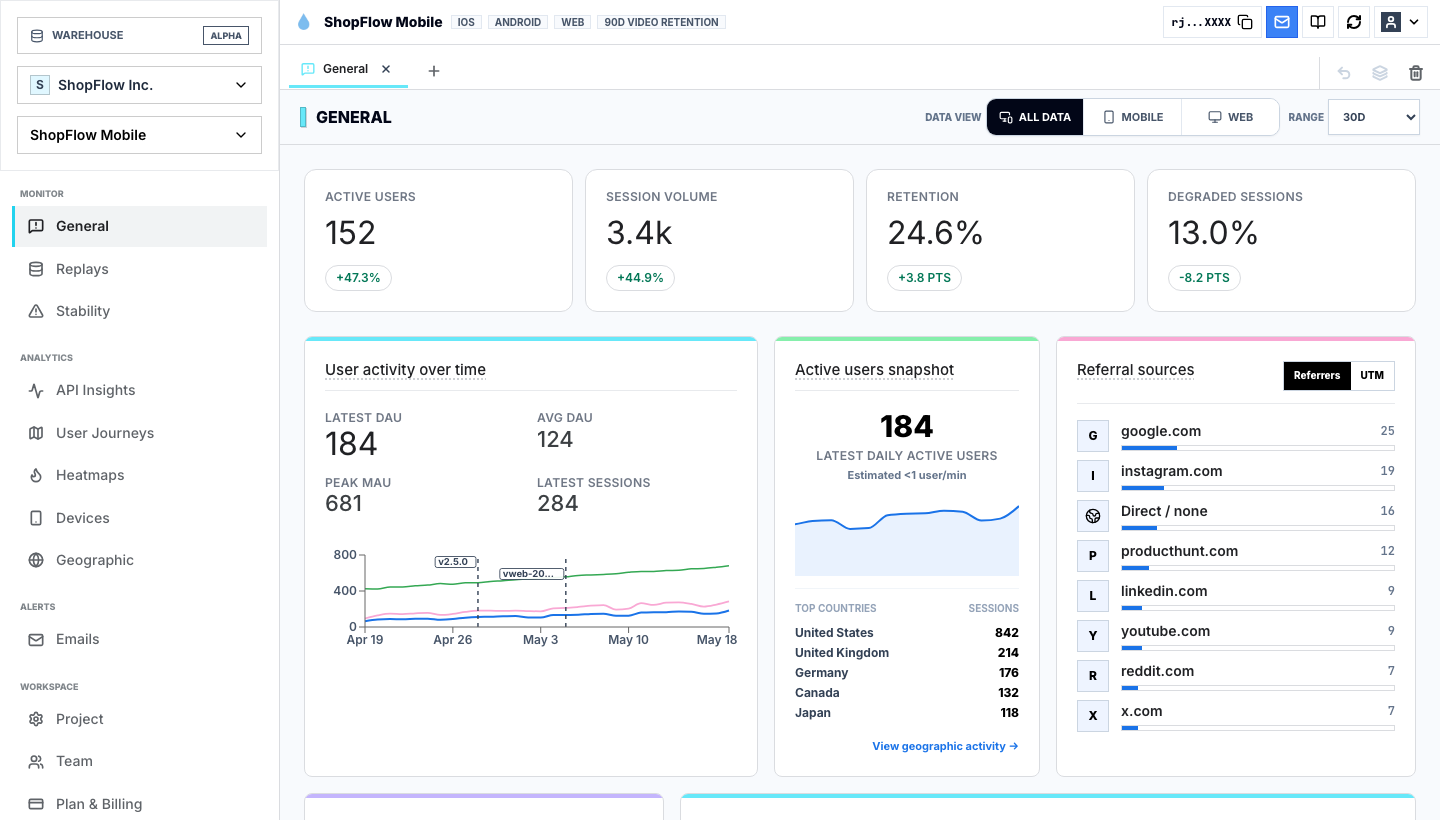
Rejourney keeps the activation event beside the path that produced it. Compare users who reached the result with eligible users who stalled, using the same cohort window and release. The session reveals whether the event represents delivered value or merely a click that fired before the result.
Build the preceding path with onboarding funnel analytics.