
Device-specific friction hides inside average product metrics
A product can look healthy overall while a device model, platform, OS version, or app version quietly carries lower engagement, longer sessions, crashes, ANRs, or rage taps.
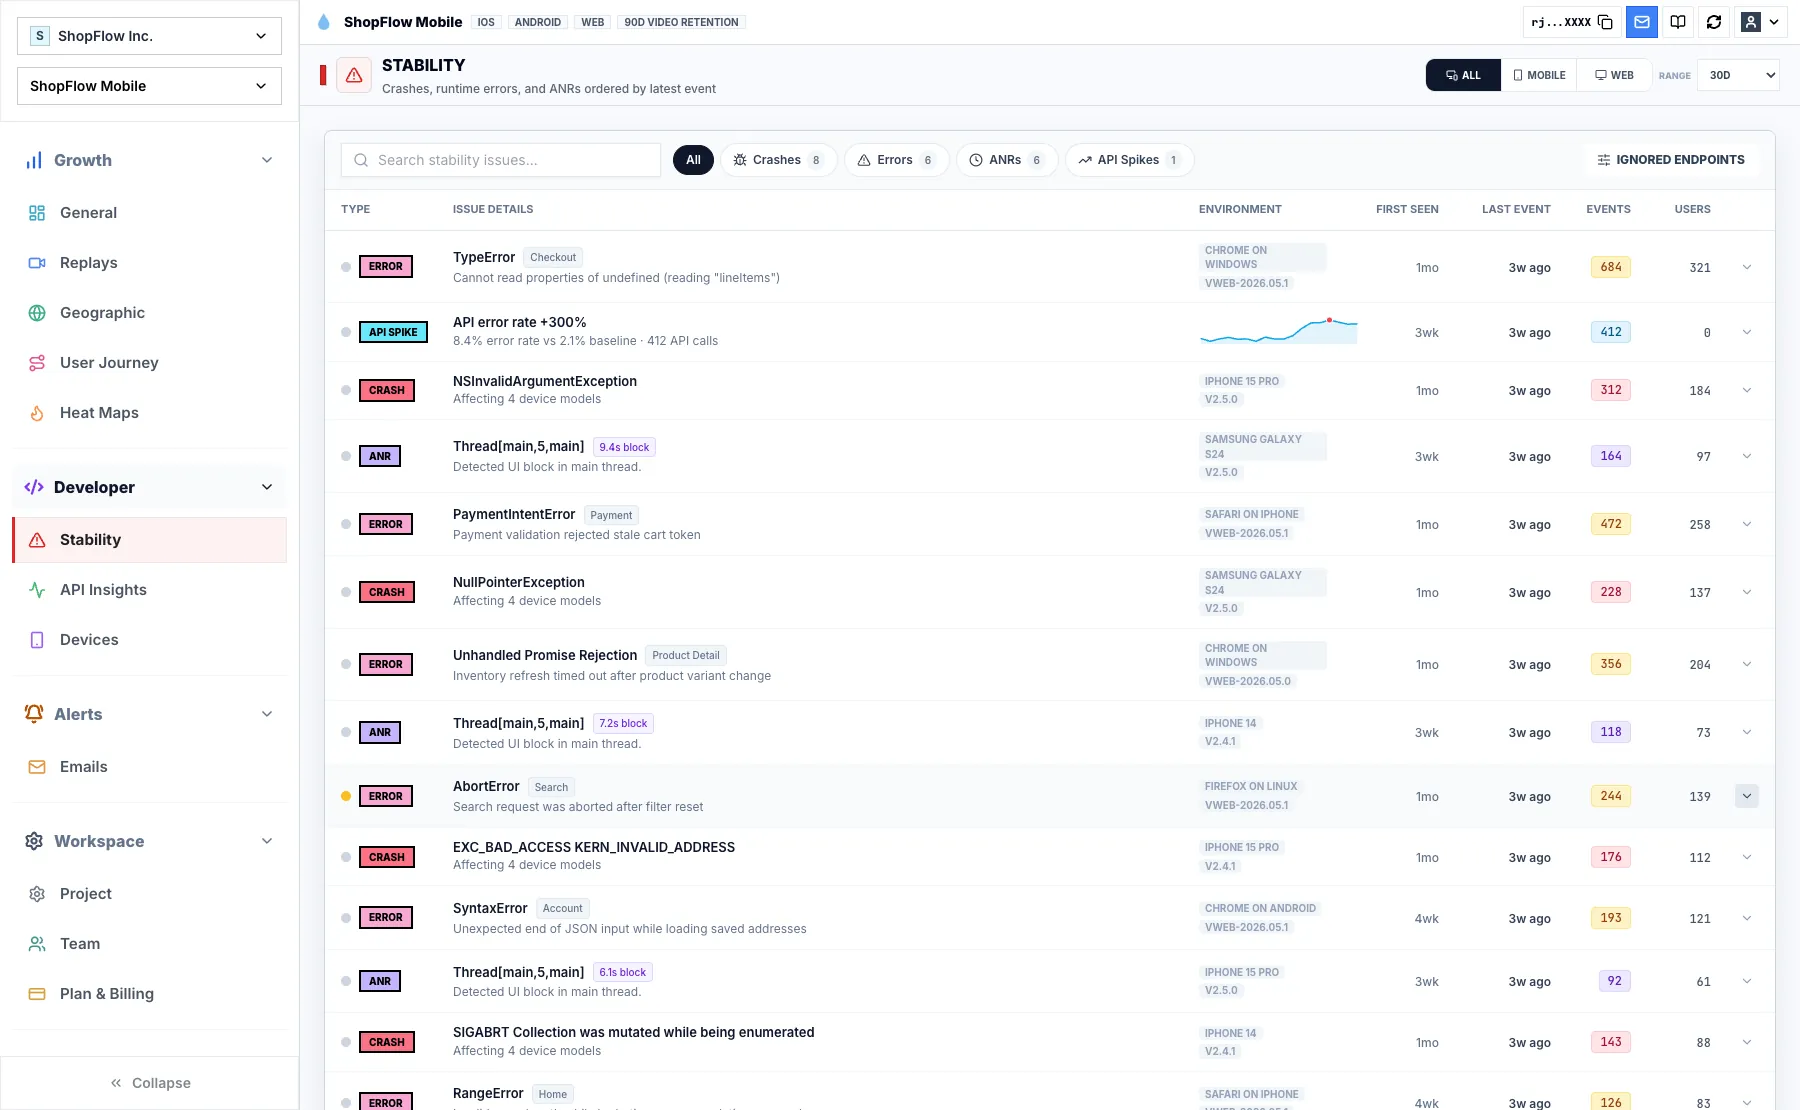
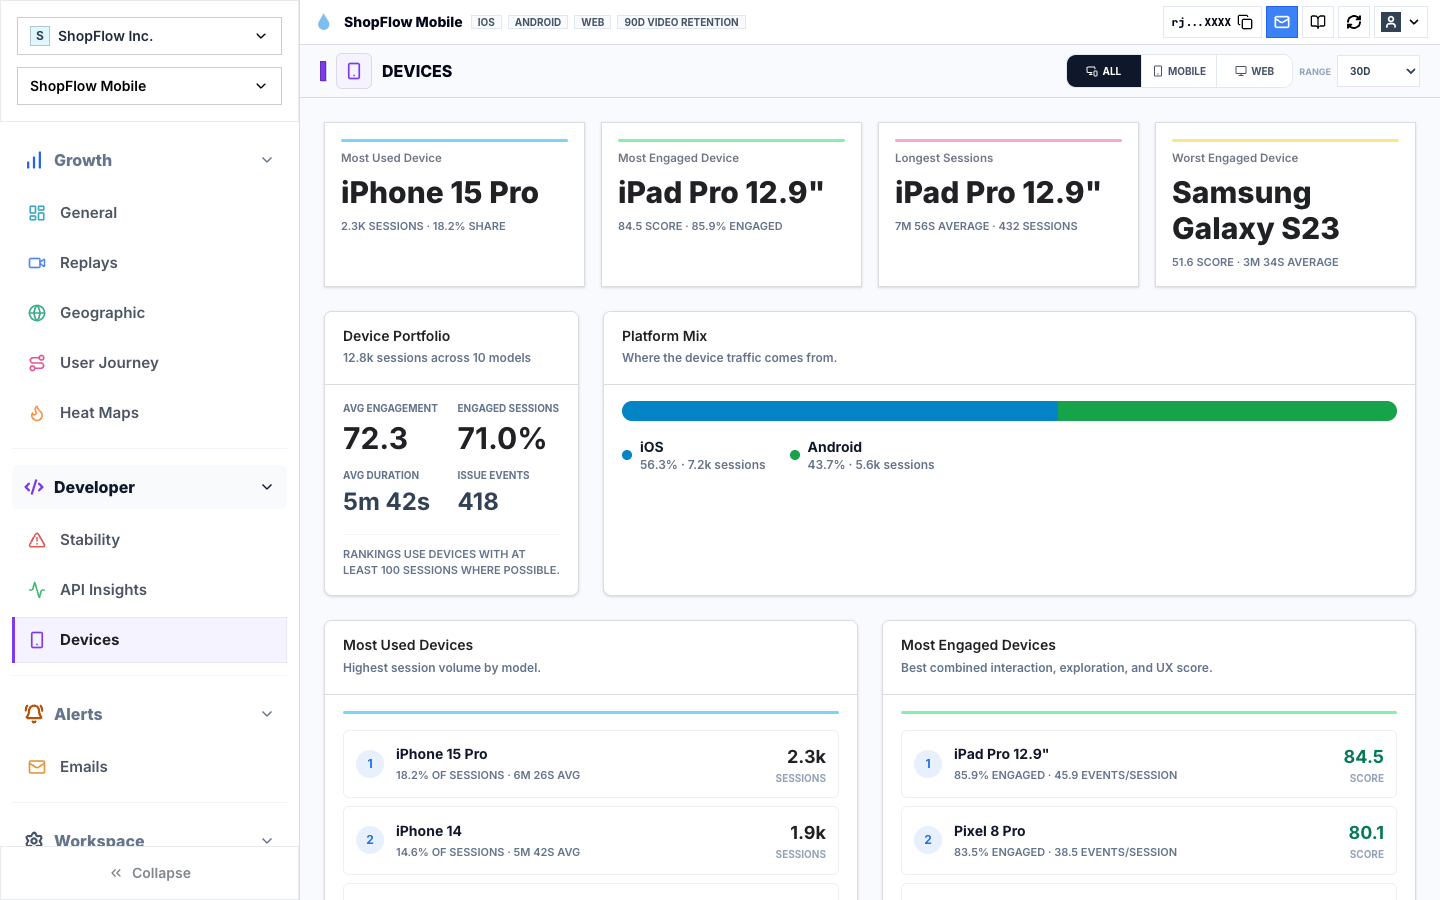
Rejourney's device insights show the device portfolio, platform mix, engagement leaders, issue pressure, and device-version hotspots so teams can find friction that averages hide.
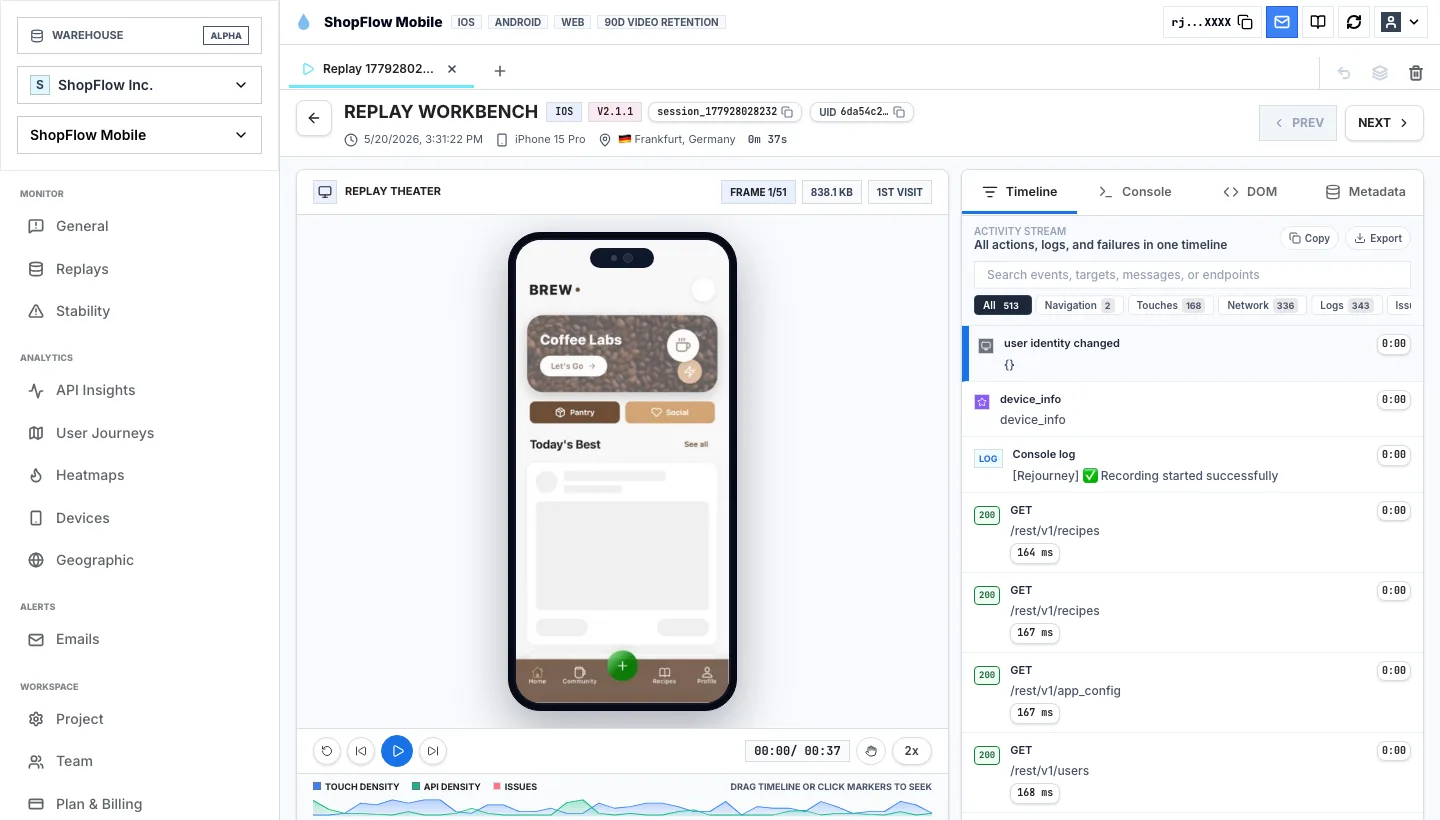
When device data stays connected to replay and stability context, engineering can reproduce issues faster and product can avoid treating a device-specific problem like a broad UX failure.
Find the device cohort hiding inside the average
Device issues rarely announce themselves in the top-line metric. One device model, OS version, or app version can carry worse engagement, longer sessions, crashes, ANRs, or rage taps while the global dashboard still looks acceptable.
Rejourney's device page shows the portfolio, platform mix, engagement leaders, issue pressure, and device-version hotspots so teams can decide whether a problem is broad UX friction or a cohort-specific production issue.
- Compare device models by sessions, engagement, duration, and issue pressure.
- Review platform mix and device-version hotspots.
- Connect device cohorts to stability and replay evidence.

Separate device pressure from product friction
A user path that fails only on one device family should not trigger the same response as a flow that fails everywhere. Device insights help the team avoid broad redesigns when the evidence points to hardware, OS, app version, or performance pressure.
That distinction matters for prioritization. Engineering can reproduce the device-specific issue while product keeps the broader funnel work focused.

Open sessions from the affected cohort
A device ranking is a clue. The proof is in sessions from that cohort: what the user tried, how the UI responded, whether a crash or ANR occurred, and which app or OS version shaped the outcome.
Pair device insights with replay and stability monitoring before deciding whether the fix belongs to UI, performance, networking, or instrumentation.

Implementation notes
These are the checks another engineer should be able to use before trusting the feature in production.
- Capture device model, OS version, app version, platform, route or screen, and stability signals.
- Rank device cohorts by issue pressure as well as volume so small but severe cohorts are visible.
- Compare device-specific failures against successful sessions from the same flow.
- Link device hotspots to replay and stability evidence before filing engineering work.
When to use a lighter signal
- Your product experience does not vary by device, OS, app version, or platform.
- You do not need to prioritize device-specific stability or engagement issues.
- Your analytics already links device cohorts to replay and stability evidence.
Questions teams usually ask
What do device insights show?
They show which devices, platforms, app versions, and device-version combinations carry session volume, engagement, duration, crashes, ANRs, errors, and other issue pressure.
Why does device analytics matter for mobile apps?
Mobile issues often appear only on certain devices, operating systems, or app versions. Device analytics helps teams find those pockets before they distort retention or support volume.
Can device insights connect to replay?
Yes. Rejourney keeps device and stability context near replay evidence so teams can inspect the sessions behind device-specific friction.
Related reading
- Pricing: See Rejourney's fixed-price plans and included platform limits.
- Live demo: Open the demo dashboard and inspect the replay, heatmap, journey, and stability views.
- React Native SDK: Install mobile session replay for React Native and Expo apps.
- Web SDK: Add browser session replay, analytics, and network capture to a web app.