Geographic analyticsRegionsWeb apps, Mobile apps, Global products

Geographic analytics for regional sentiment and UX friction

Map positive, neutral, and frustrated sessions by region so teams can see where UX, network, language, or market-specific friction is clustering.

Rejourney geographic analytics map showing session sentiment by region
Spot the market where experience changedRegional analytics keeps the map connected to real sessions so teams can see what users experienced.

Regional friction hides inside global averages

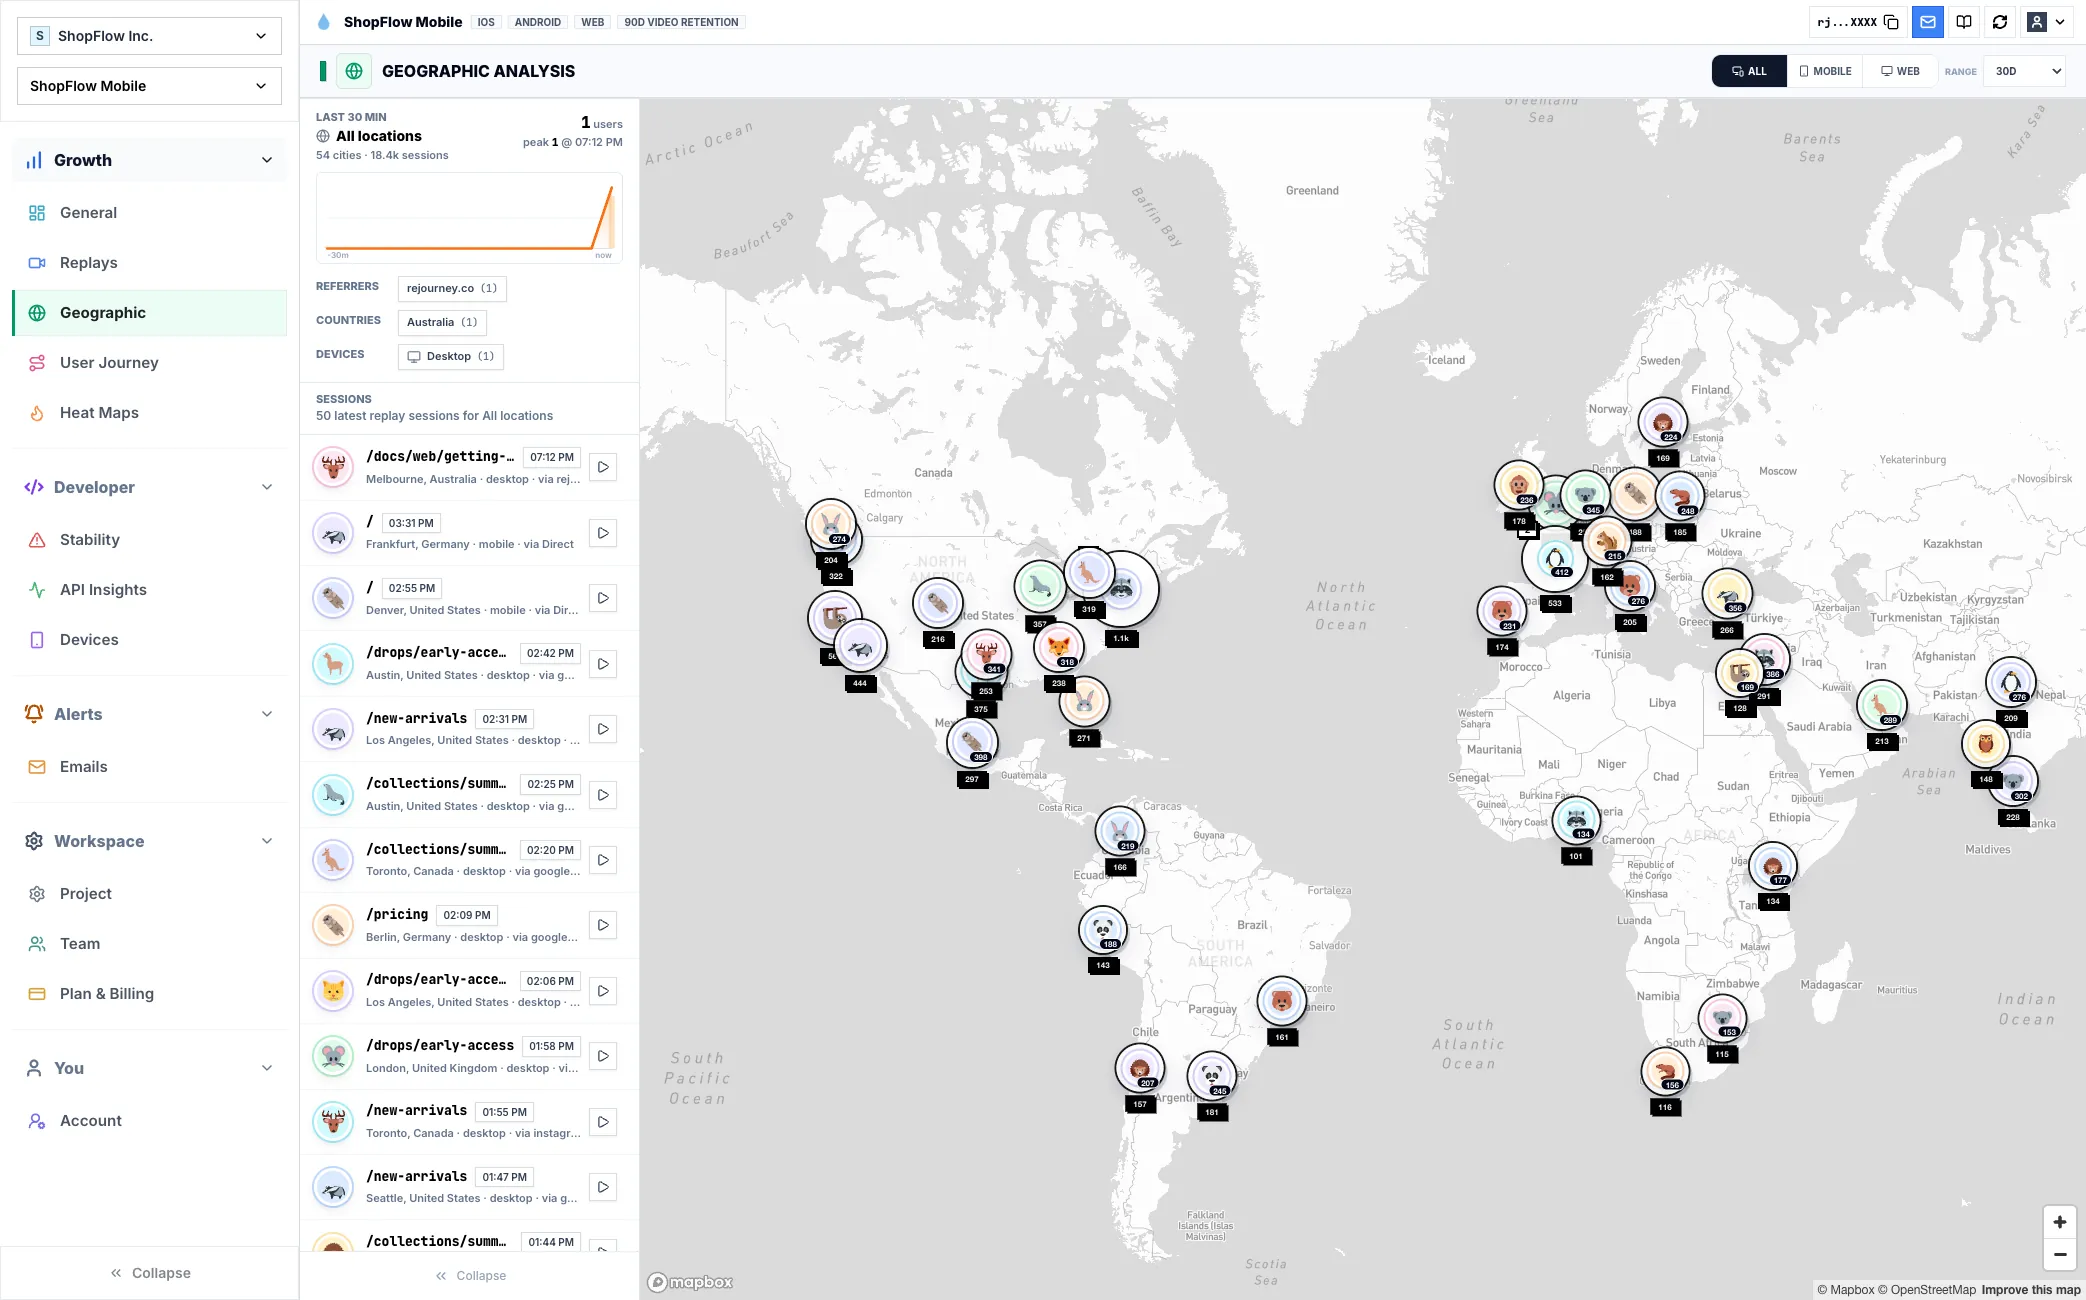
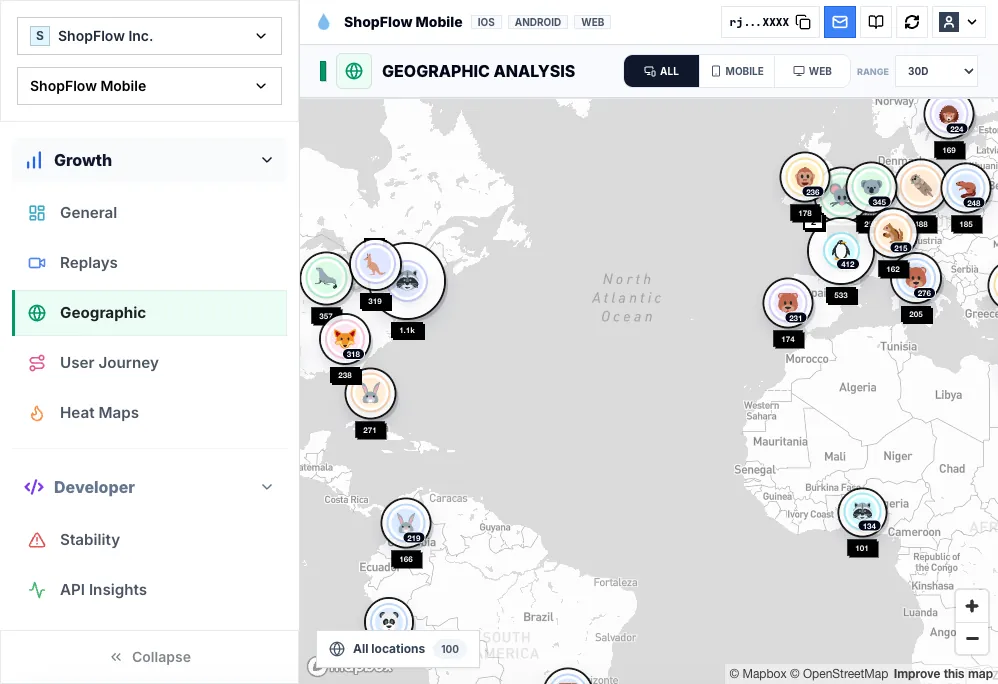
A global conversion rate can look fine while one market is getting slow requests, confusing copy, missing payment options, or frustrated sessions. Geographic analytics makes those regional clusters visible before they become a support pattern.

Rejourney maps session sentiment and friction by country, then keeps the underlying replay evidence close enough to inspect what users actually experienced in that market.

That gives product, growth, and support teams a shared way to decide whether a regional issue is UX, infrastructure, localization, or funnel design.

Start from the question the team needs to answer

Replay is most useful when it is tied to a specific product or support question: why a flow dropped, why a user got stuck, why a release created tickets, or why a screen behaved differently in production than it did in QA.

For developers, the implementation goal is to make that session searchable and explainable later. Capture the route or screen, release version, platform, product events, and the technical signals that explain what happened around the visual session.

  • Route or screen name
  • SDK and app version
  • Key product events
  • Failed requests, console logs, crashes, or ANRs
Rejourney geographic intelligence card showing regional UX friction
Regional frictionUse map-based context to prioritize local UX and infrastructure issues.

Use the replay to find the pattern behind the clip

A single recording can show the first clue, but it should not become the whole argument. After watching the session, filter for similar routes, devices, versions, failed requests, or journeys to see whether the behavior repeats.

The productive loop is to move between the individual session and the aggregate views. Replay explains the moment; journeys, heatmaps, events, and stability views show whether that moment deserves engineering time.

Rejourney replay evidence for regional sessions
Regional replayOpen real sessions behind the regional signal.

Keep capture boring, private, and reliable

Treat replay instrumentation like production telemetry. Mask sensitive fields by default, verify the SDK does not capture private content, and roll the integration out first on a flow where the team can quickly validate data quality.

Once the basics are trustworthy, expand coverage intentionally. Good replay data is consistent enough that a ticket, release review, or bug report can point to a session and everyone can inspect the same facts.

Rejourney heatmap analytics view
HeatmapsSee where attention and friction cluster across screens.

Implementation notes

These are the checks another engineer should be able to use before trusting the feature in production.

  • Name routes, screens, and important states clearly enough that another engineer can search for them later.
  • Attach release, app version, browser, OS, and device context before relying on replay for triage.
  • Mask private UI by default, then explicitly allow only the surfaces the team needs.
  • Verify one successful and one failed session for the target flow before calling the integration ready.

When to use a lighter signal

  • Your product does not vary meaningfully by market, language, infrastructure, or payment method.
  • You do not need country-level replay evidence behind a regional spike.
  • Your current analytics already connects region, sentiment, and session context.

Questions teams usually ask

What does geographic analytics show?

It shows where session volume, sentiment, and friction cluster by country or region, with replay context for the sessions behind each cluster.

Why track sentiment by region?

Regional sentiment helps teams catch local UX, network, language, payment, or infrastructure issues that disappear inside global averages.

Can I open sessions from a region?

Yes. The workflow is designed to connect regional signals back to replay evidence so teams can inspect the actual sessions behind the map.

Related reading

  • Pricing: See Rejourney's fixed-price plans and included platform limits.
  • Live demo: Open the demo dashboard and inspect the replay, heatmap, journey, and stability views.
  • React Native SDK: Install mobile session replay for React Native and Expo apps.
  • Web SDK: Add browser session replay, analytics, and network capture to a web app.