
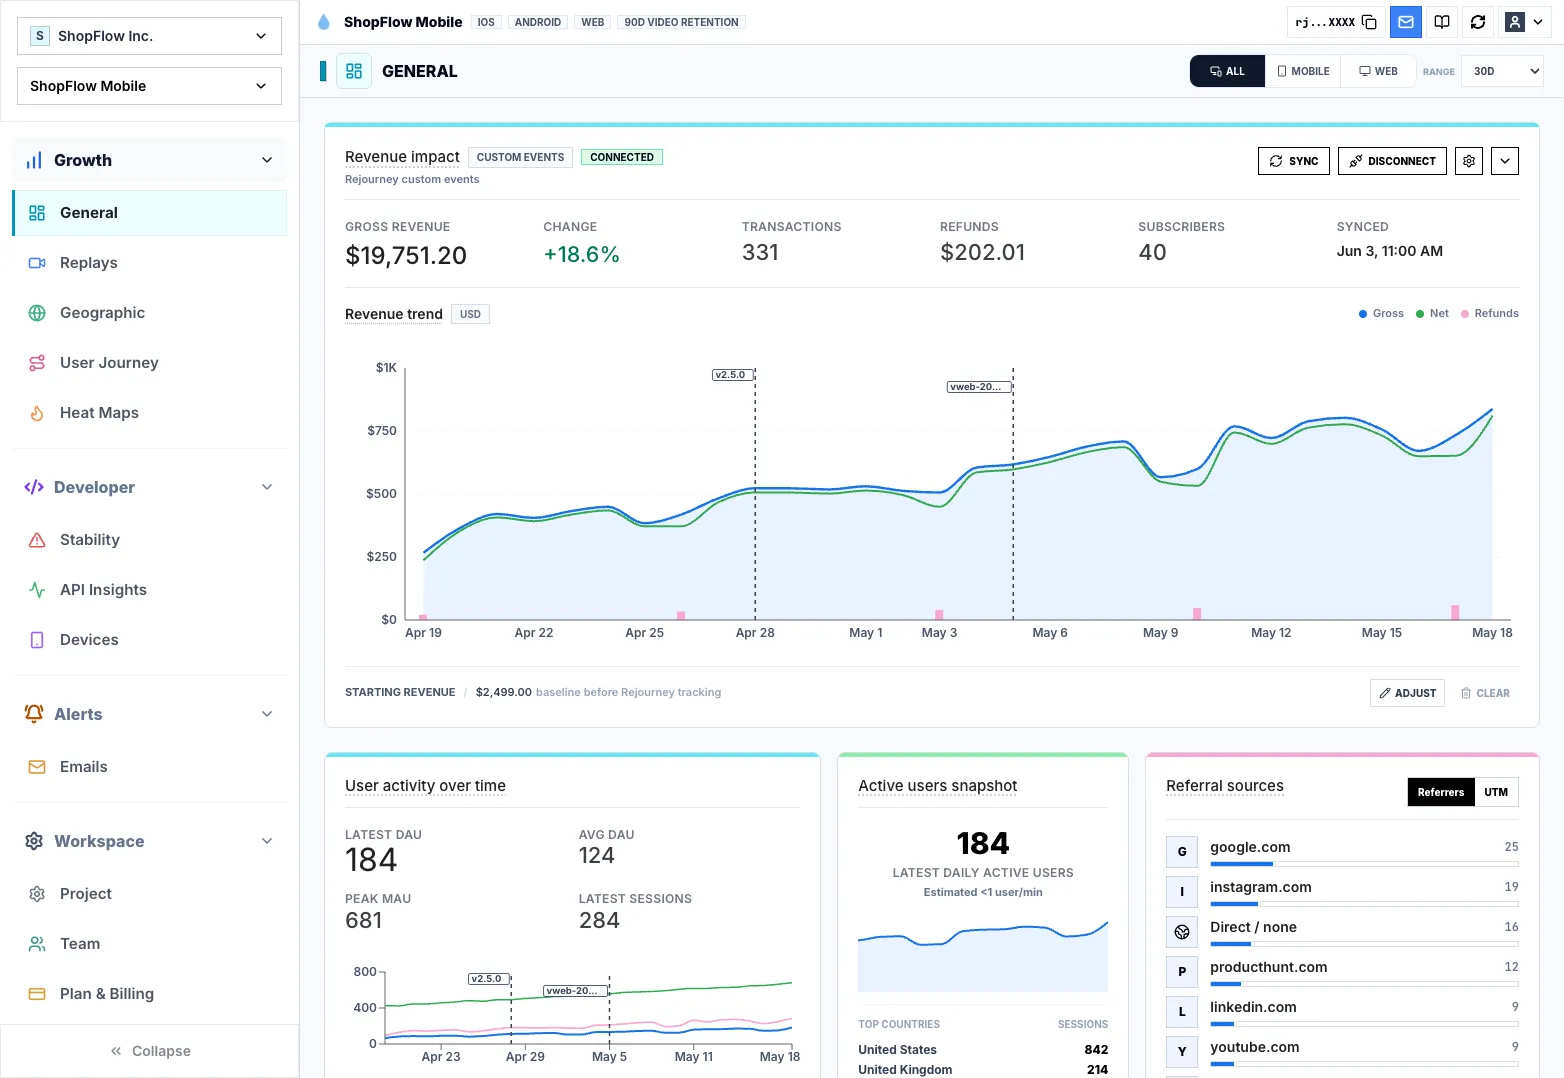
1. Revenue movement
Revenue movement
Revenue drops rarely explain themselves. A release, a checkout change, a slow screen, or a confusing path can move gross revenue, transaction count, active users, and retention at the same time.
Revenue recovery
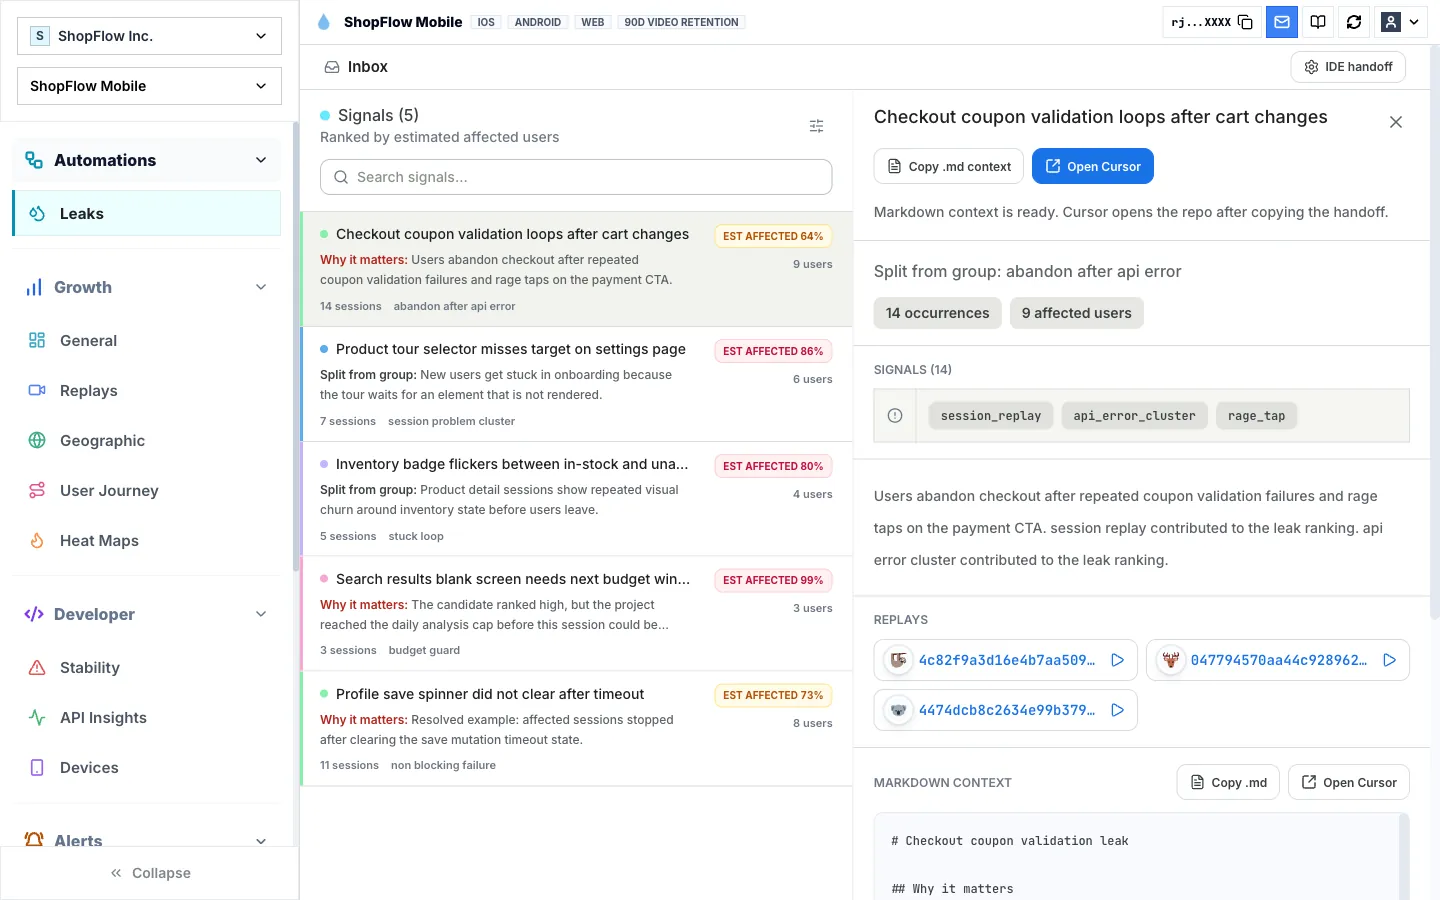
Link gross revenue drops directly to failed checkouts and releases. Recover leaked carts with replay evidence.
Install alongside your existing analytics and evaluate it with real sessions before committing.
Verified customer result
103% sales increase

Burst Creatine
Replay evidence exposed conversion friction in a revenue-critical journey so the team could fix the proven failure first.
From signal to answer
1. Revenue movement
Revenue drops rarely explain themselves. A release, a checkout change, a slow screen, or a confusing path can move gross revenue, transaction count, active users, and retention at the same time.
2. Release markers
Rejourney keeps the revenue view close to session evidence, so growth teams can move from a metric change to the user behavior and product state that likely caused it.
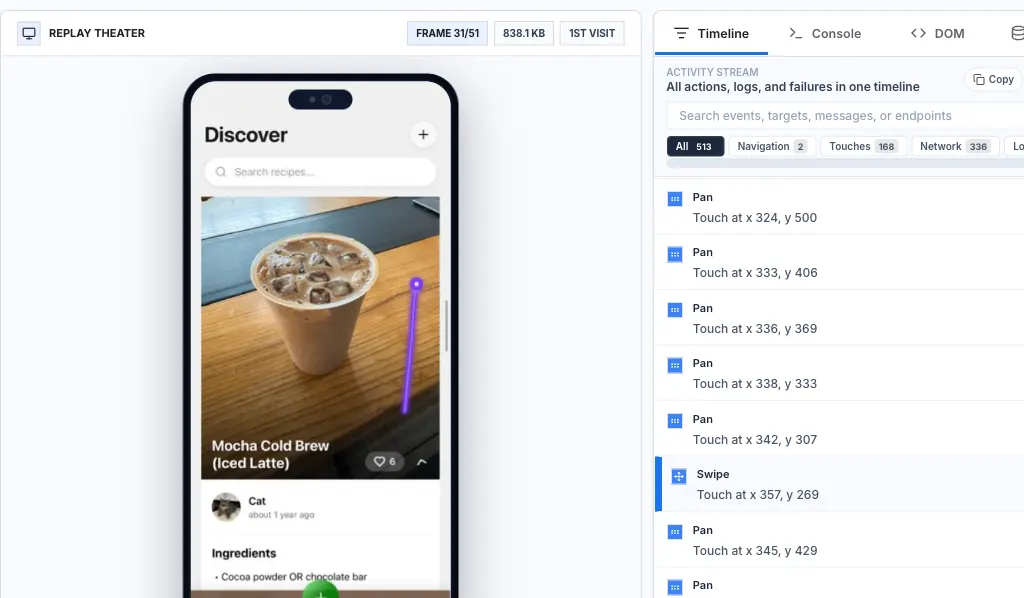
3. Session context
That makes growth work less about dashboard watching and more about recovery: identify the movement, inspect the sessions, prioritize the leak, and confirm the fix.
Keep exploring
It keeps revenue and product metrics near replay, journey, and issue evidence so teams can inspect the sessions behind a movement instead of stopping at the chart.
Yes. Growth teams can identify affected flows and users, then bring engineering a bounded issue with replay evidence when a fix is needed.
Revenue trend, transaction count, active users, retention, release markers, affected segments, and matching sessions are the most useful starting points.
Start with a real product
Start free with 5,000 monthly sessions, unlimited analytics events, and no credit card.