
Website revenue often starts leaking as a small product regression: a form no longer confirms submission, an authentication callback loses the intended route, a pricing experiment hides the primary action on one viewport, or a checkout request becomes slower than the UI timeout.
Traffic and revenue can remain within a normal-looking range while those sessions accumulate. By the time the monthly report shows the loss, the team may have shipped several more changes.
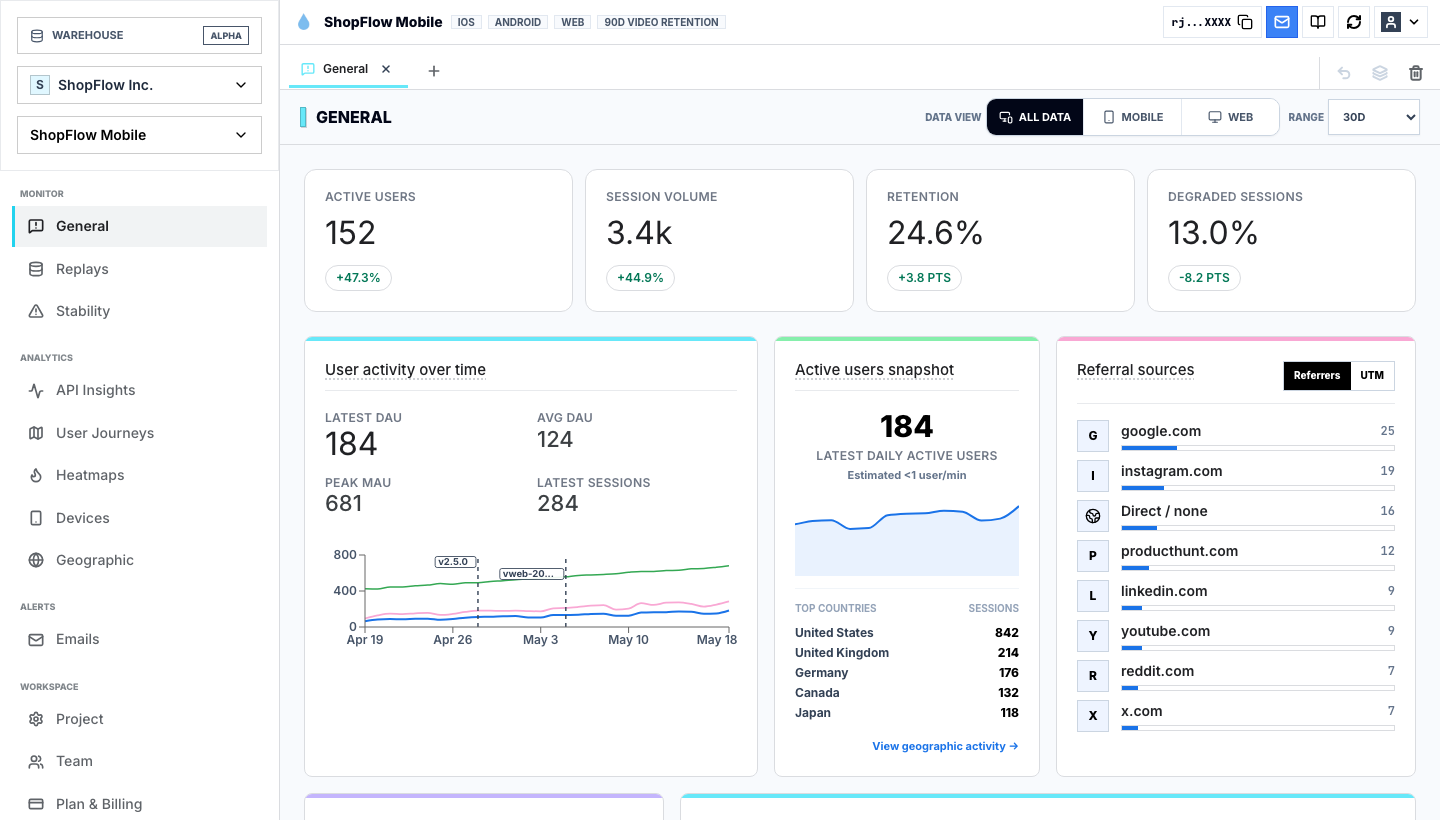
Revenue loss prediction for websites means monitoring leading conversion and technical evidence at valuable transitions, ranking unusual failure above a healthy baseline, and attaching the browser sessions that explain the risk.
Define the website outcomes worth protecting
Choose explicit business states: qualified signup; onboarding activation; lead or application submission; trial start; and checkout start and completion.
The same analysis should cover payment and order confirmation; subscription and entitlement; booking or reservation; and account renewal or upgrade.
A detector should identify the transition at risk. Generic bounce and page-exit alerts create noise because leaving can be a healthy end to many web sessions.
Build the web revenue state map
For each outcome, connect:
eligible session → route and UI state → action attempted → request result→ server business state → visible confirmation → downstream valueSingle-page applications need route and component state, not only page loads. Server-rendered forms need backend and confirmation state. External authentication and payment flows need the departure and return path.
The browser event says what the interface attempted. The backend establishes whether the valuable state occurred.
Use leading website signal families
Journey data gives the first warning. Loss rises at one valuable transition, users begin looping between routes, or the time between intent and success stretches. A campaign callback that returns people to the wrong route belongs in this group too.
The session often supplies the next clue. Look for repeated submissions, validation loops, clicks that receive no visible acknowledgement, or an important control that sits outside the observed viewport. JavaScript exceptions and slow or failed requests matter when they occur in the same cohort, especially after a release.
Commercial state provides the strongest confirmation. A payment without an order, a subscription without entitlement, or a successful server action without a visible confirmation is more than an ambiguous exit.
When several families agree on the same transition and cohort, the prediction becomes more credible.
Detect excess failure at the transition
Compare current failure with a healthy baseline for the same route, traffic source, device class, region, and release where appropriate.
excess failed intent = eligible attempts × (current failure rate - baseline failure rate)Set minimum volumes and longer windows for low-traffic flows. Account for campaigns, weekday effects, experiments, and product launches.
Keep potential impact separate from confidence. High traffic does not make an ambiguous exit a confirmed revenue leak.
Use releases as prediction context
Attach frontend and backend release markers to revenue-critical transitions. Compare new traffic with the prior stable release.
Watch for: conversion change by release; error and request behavior; new route or journey branches; browser and viewport concentration; confirmation and business-state contradictions; and support and replay evidence.
This narrows the investigation before a regression becomes a broad site redesign.
Find browser and viewport leaks
A website can look healthy globally while one browser, responsive breakpoint, embedded webview, or device class fails.
Segment by: browser and major version; device category and viewport; operating system; route and SPA state; release and experiment; acquisition source and campaign; and country or region when infrastructure differs.
Open healthy and failed sessions from the same cohort. Look for obscured actions, layout shifts, focus loss, failed hydration, stale UI, and requests that complete after the user leaves.
Connect API risk to user intent
An API error matters differently depending on the state it blocks. A small failure rate on payment confirmation or account activation can outrank a larger rate on a background refresh.
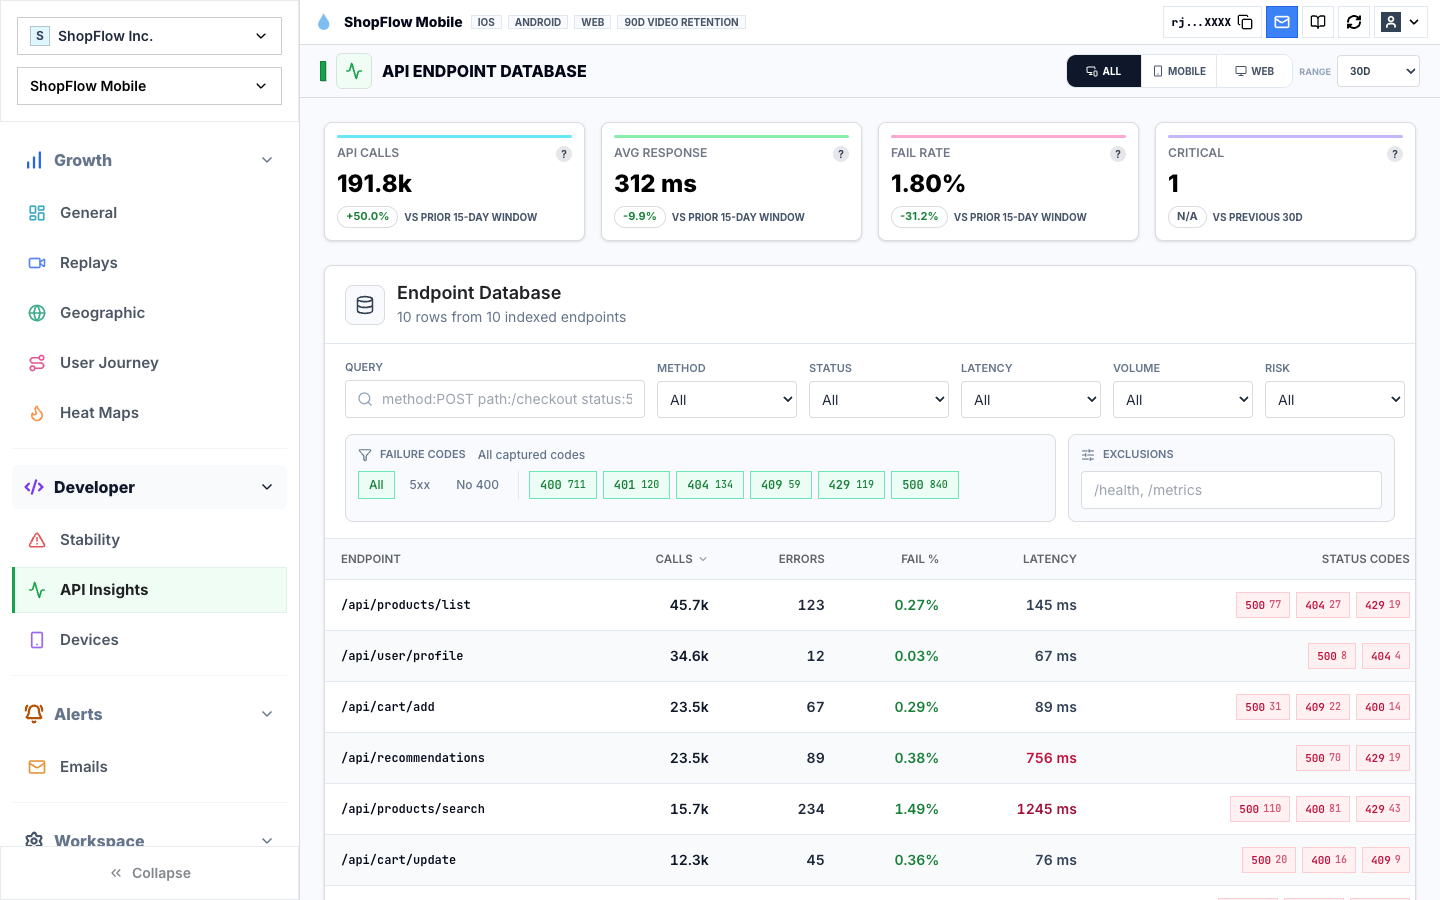
Capture sanitized endpoint family, method, latency, status category, route, release, and session. Avoid tokens, passwords, payment details, and sensitive payloads.
Translate technical evidence into product impact: “The confirmation request exceeded the UI timeout in 9% of submitted checkout sessions” is more useful than an isolated p95 chart.
Treat forms as stateful workflows
Lead, signup, application, and checkout forms can leak through: validation after substantial input; lost values on navigation or authentication; duplicate submissions; server success with missing confirmation; file upload or verification failure; disabled controls without explanation; and keyboard or autofill behavior.
Track attempt, validation, request, server state, and visible result. Replaying only the final click misses the effort and uncertainty before it.
Detect false failure and false success
High-confidence contradictions are easy to state. The UI reports failure even though the server recorded success, or it reports success while business state is missing. Payment can succeed without an order or entitlement. A form confirmation can appear without a persisted submission. Authentication can complete and still return the user to the wrong flow.
These conditions create revenue loss, duplicate attempts, support cost, and distrust. Reconcile the system state and attach sessions showing the user impact.
Rank by recoverable intent
Prioritize using: eligible users affected above baseline; value of the protected outcome; evidence confidence; recoverability; customer harm; recency and trend; and release or segment concentration.
Do not label all exits as recoverable revenue. Estimate only excess failure with explicit assumptions and a historical outcome appropriate to the same population.
Verify the original cohort after a fix
Preserve the route, transition, browser, device, release, campaign, experiment, and replay query. After deployment, compare: excess failure and time to success; interaction and error signals; server and visible state agreement; completed business outcomes; refund, cancellation, support, or retention guardrails; and new branches or regressions.
Revenue recovery is the healthy outcome observed after the fix, not the forecast attached to the alert.
Investigate the web sessions behind the forecast
Rejourney connects a risky web transition to the browser sessions and application evidence behind it. A reviewer can isolate the route, release, viewport, or campaign where excess failure appeared, then compare failed sessions with successful users from the same cohort.
The web session replay page describes the capture surface, while revenue leak detection explains the scoring and verification method.