
Cancellation is a precise churn signal and a late one. By the time the event appears, the user may have spent weeks receiving less value, encountering repeated friction, losing a teammate, or failing to recover a payment.
Subscription churn prediction tries to identify that change early enough for a useful response. The goal is not to declare that a customer will leave. It is to rank accounts or users whose recent evidence suggests value or reliability is deteriorating, then explain why the signal appeared.
Define the churn outcome before building predictors
Subscription businesses have several churn states: voluntary cancellation; non-renewal at the end of a term; involuntary loss after failed payment; downgrade or contraction; product inactivity while the subscription remains active; and account closure with continued individual use elsewhere.
Do not train or evaluate one label that mixes outcomes with different causes and remedies. A payment-recovery system may help involuntary churn. It will not fix a product that never activated the customer.
Define the observation window, outcome window, account unit, and grace period. For team products, decide whether churn is predicted at user, workspace, contract, or subscription level.
Establish the account’s normal rhythm
Raw inactivity is a weak signal without context. A daily operations product and a quarterly reporting tool should not use the same threshold.
Build a baseline from the account’s own healthy periods and comparable accounts: expected session or active-day cadence; core action frequency; breadth of meaningful feature use; number and role of active users; time to complete recurring workflows; normal support and error volume; and billing and renewal calendar.
Prediction becomes more useful when it recognizes a change from expected behavior rather than punishing naturally infrequent use.
Use signal families that tell different stories
Value signals
Did the account reach activation? Is the core result still produced? Are users repeating the action that justifies the subscription?
Engagement-shape signals
Look beyond visit count. Fewer key collaborators, narrower feature use, abandoned recurring work, or a longer time between value events may matter more than total clicks.
Friction signals
Repeated errors, slow requests, crashes, ANRs, rage taps, dead controls, and journey loops can erode value even while usage remains high. Heavy activity can be a sign of struggle.
Commercial signals
Plan-limit visits, billing-page activity, downgrade attempts, failed renewals, method updates, or repeated pricing comparison may indicate commercial risk. Treat sensitive billing data with appropriate controls.
Relationship signals
Support escalation, unresolved defects, champion departure, or loss of an administrator can change account health. These signals may live outside product analytics and should be joined through safe account identifiers.
Distinguish low use from failed use
The final high-intent session often explains more than an activity score.
For an account whose core usage declined, find the last sessions where users attempted a meaningful outcome. Did they succeed and stop because the job was complete? Did they encounter missing data, a slow request, unclear state, or a crash? Did they repeatedly visit help or settings?
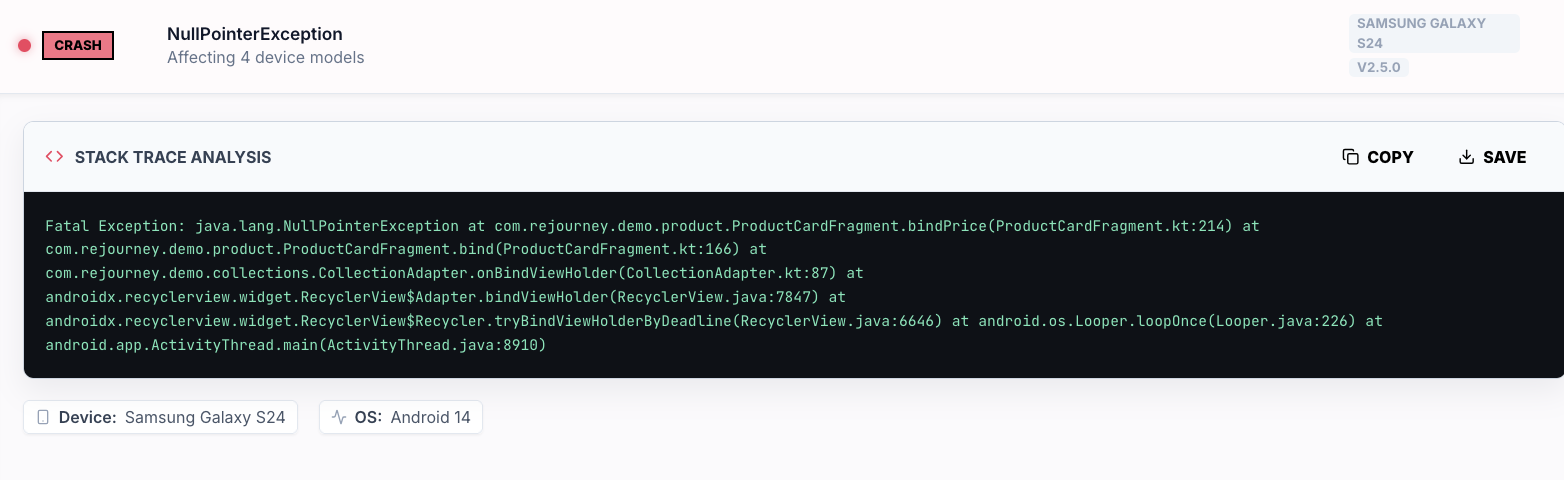
Low use after successful value may be normal. Low use after repeated failed intent is actionable product risk.
Engineer features that can be explained
A churn model can absorb hundreds of properties and still produce a useless conversation. Prefer features the team can interpret and change.
Examples: days since last successful core action; change in active collaborators from account baseline; failed-to-successful core action ratio; increase in p90 time to complete a recurring workflow; and count of high-severity session issues in the last 14 days.
Review number of consecutive sessions without first value for a new account; renewal failure with no successful method update; and repeated plan-limit encounters without upgrade.
Keep the time window with every feature. “Five errors” means little without knowing whether they happened in one minute, one week, or fifty sessions.
Prevent leakage in the model itself
Prediction can accidentally use information that only exists after the outcome. Cancellation confirmation pages, post-cancel surveys, and account state changes should not appear in a model intended to predict cancellation beforehand.
Use a clear timeline:
observation window → prediction time → outcome windowAll predictive features must be available before prediction time. Evaluate by time-based cohorts so the model does not learn from future product behavior or repeat users across training and validation in misleading ways.
Score reason and confidence beside risk
A single 0–100 score creates false precision. Present the leading reasons and evidence quality.
An account card might say: risk: elevated; change: successful weekly export stopped after release 8.4; evidence: three failed export sessions, two API timeouts, one support visit; and confidence: high for product friction; unknown for cancellation intent.
That framing helps the team fix the export problem without pretending the system knows the customer’s decision.
Evaluate ranking, timing, and actionability
Model accuracy alone is not enough. A prediction made two hours before cancellation may be correct and useless.
Evaluate: precision among the accounts the team can realistically review; recall for important churn outcomes; lead time before the outcome; calibration by segment and plan; stability after releases and pricing changes; percentage of alerts with an actionable reason; and outcome after the relevant product or recovery action.
Compare against simple baselines such as days since last value event. A complex model should earn its operational cost.
Avoid punishing healthy segments
Usage patterns differ by plan, role, lifecycle stage, company size, platform, and product job. Test error rates across those groups.
A model trained mainly on small self-serve accounts may misclassify enterprise workspaces with periodic use. A new-user model may interpret expected setup friction differently from an established-account model.
Keep separate models or thresholds when the behavior and response differ materially.
Route the signal to the right owner
Not every churn risk belongs to customer success.
| Leading reason | Likely first owner |
|---|---|
| Never reached first value | Onboarding and product |
| Repeated API or stability failures | Engineering |
| Plan limit or packaging mismatch | Product and revenue |
| Failed renewal or stale method | Billing and lifecycle |
| Champion or collaborator loss | Customer success |
| Unknown decline with no clear friction | Research or account review |
The score should shorten routing, not create a generic save campaign.
Learn from the outcome without rewriting history
After churn or continuation, preserve the evidence available at prediction time. Review false positives and false negatives.
A false positive may be a healthy seasonal account, a successfully resolved issue, or a user who completed their job efficiently. A false negative may reveal a missing relationship or billing signal, a new product failure, or a cancellation unrelated to observable behavior.
Update definitions carefully. Do not add post-outcome information to old predictions and call the system more accurate.
Read the behavior behind a churn score
A churn signal in Rejourney can open the recent sessions that changed the score. The reviewer sees whether the customer stopped reaching a core result, began encountering failures, or struggled with subscription state. Account history supplies the baseline; replay supplies the product evidence.
For the recurring commercial path, use subscription funnel analytics.