
A funnel begins with a theory: users should move from A to B to C. Customer journey analytics begins with a different question: after A, where did users actually go?
That difference matters in products with search, settings, help, multiple roles, external authentication, mobile backgrounding, or more than one route to value. A funnel can report a drop when the user took a valid alternate path. It can also report success while hiding the loops and repeated effort required to get there.
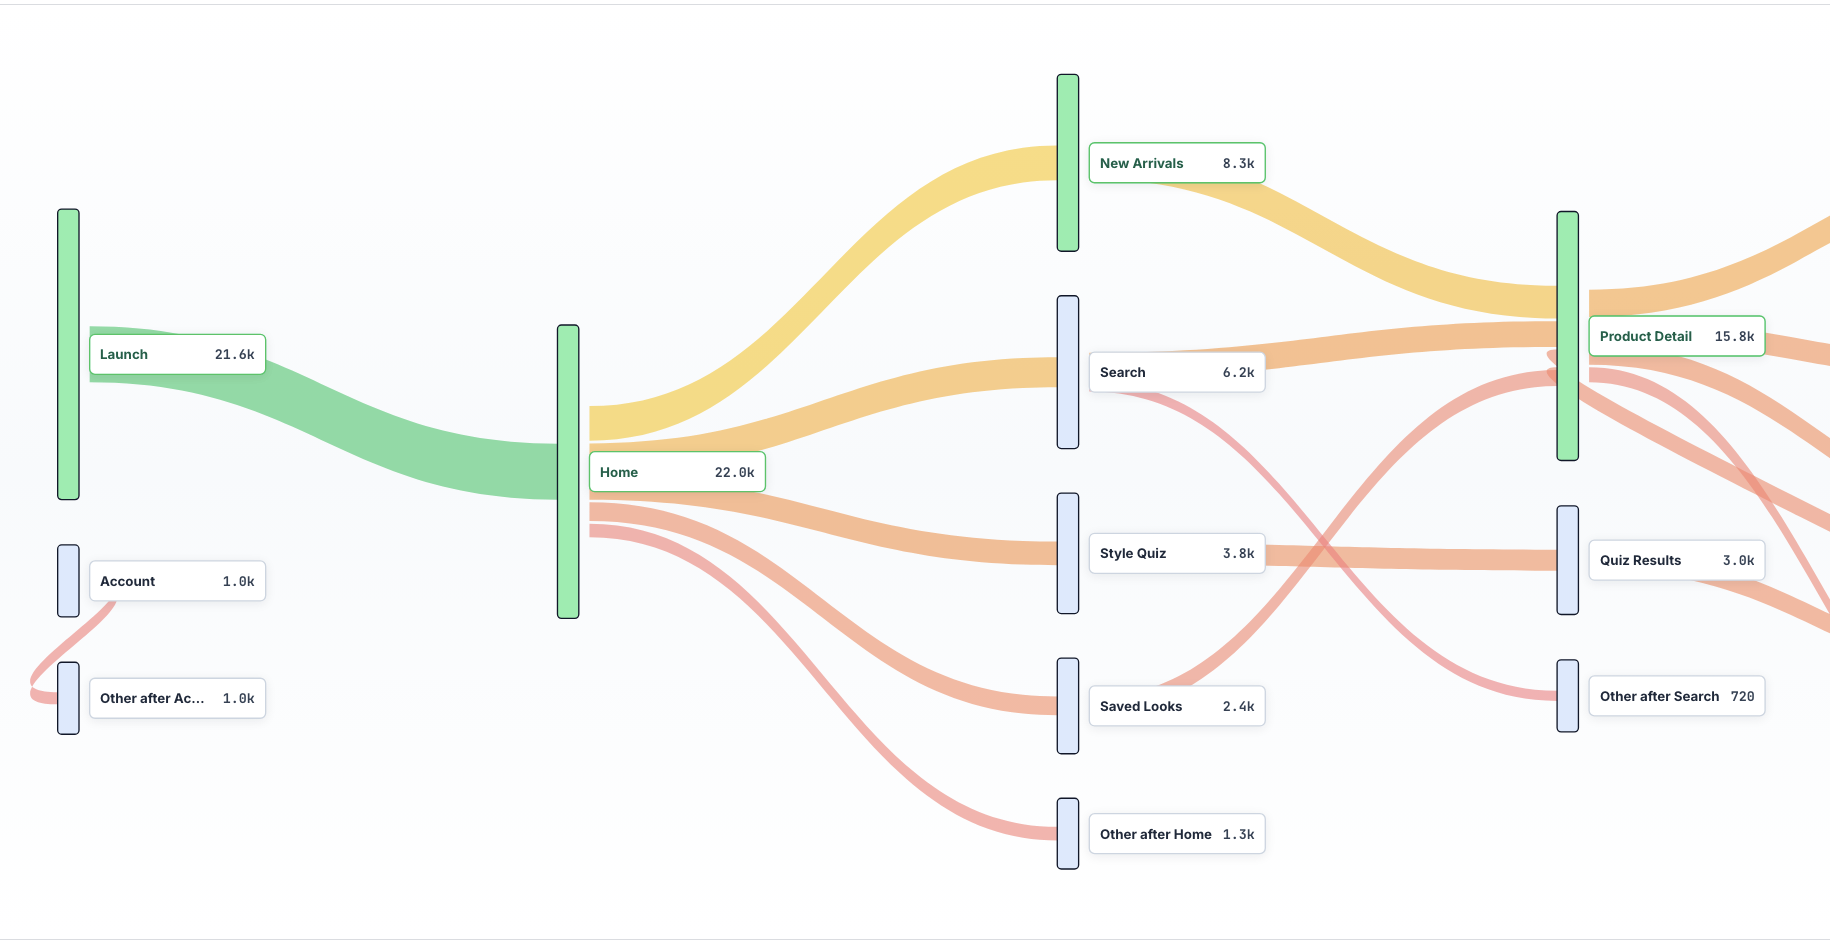
Use funnels and journeys together
Funnels are best for a defined outcome and ordered states. Journeys are best for discovering routes, branches, and behavior around those states.
| Question | Better starting view |
|---|---|
| What share completed checkout? | Funnel |
| What did users do after pricing? | Journey |
| Which onboarding step loses the most users? | Funnel |
| Do failed users loop through settings and help? | Journey |
| Did payment reach healthy order state? | Funnel |
| Where do users go after a failed payment? | Journey |
Use the funnel to quantify the leak and the journey to understand the path around it.
Normalize events into product states
Journey maps become unreadable when every component event or dynamic URL becomes a node. Define a stable vocabulary: product screen or route family; meaningful state change; core action outcome; error or recovery state; external transition such as authentication; and session start, background, return, and exit where relevant.
Normalize identifiers and query strings that do not change the product meaning. Keep important context—plan, role, result, release—as attributes rather than exploding the number of nodes.
The map should use language the product team recognizes, not implementation details from the router.
Choose a bounded population
“All journeys” usually produces a picture of traffic volume rather than insight. Begin with one cohort and one anchor. That might be new accounts after signup, users who viewed pricing, or sessions that entered checkout. Trial activation, pre-cancellation behavior, a recent release, and a specific device are other useful boundaries when they match the question being investigated.
Then choose the number of steps or time window around the anchor. This creates a map the team can compare and reopen.
Read loops as effort, not automatic failure
Backtracking can be healthy. Users compare plans, revisit documentation, or check information before a consequential decision.
A loop becomes suspicious when it correlates with failed outcomes, repeated interaction, long delay, error signals, or a change after release.
Examples: checkout ↔ pricing repeated before exit; integration setup ↔ credentials help with failed verification; upgrade ↔ billing settings because the user lacks permission; search ↔ empty result across several queries; and payment ↔ authentication callback without restored state.
Compare the loop frequency and outcome with successful sessions. Do not assign “friction” based on path shape alone.
Measure transitions beyond raw count
For each important edge, consider: unique users and sessions; share of eligible journeys; successful outcome rate after the transition; median and tail time to next meaningful state; repeat count or loop depth; error, crash, or slow-request rate; and change by release, platform, device, role, or plan.
Weighted path maps reveal volume. These additional measures reveal quality.
Compare healthy and degraded paths
Create two populations around the same intent: users who reached the goal and users who did not. Then identify where their paths diverge.
Healthy users may reach a result immediately after setup while degraded users visit settings twice, open help, return to setup, and leave. Checkout completers may move directly from authorization to confirmation while failed sessions return to the payment form after an external challenge.
The divergence produces a hypothesis. Replay and technical context establish what the user experienced there.
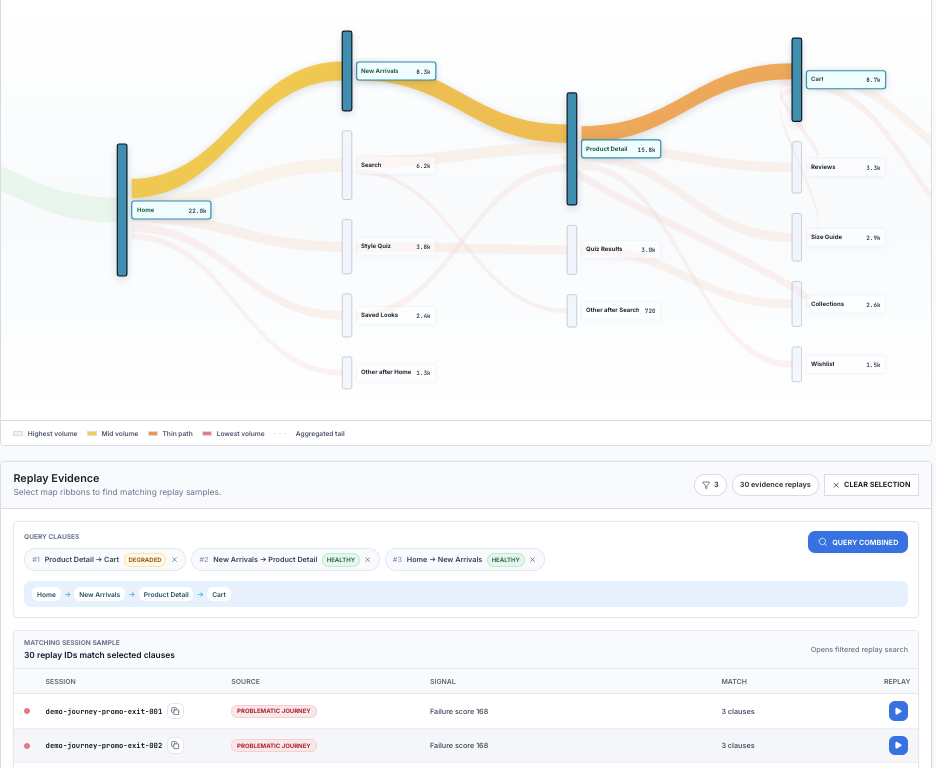
Open replay from the transition
Random replay review creates anecdotes. Journey-linked replay preserves the query that made the session relevant.
For a selected edge or loop, open: representative successful sessions; failed sessions with technical signals; failed sessions without obvious errors; sessions before and after a release; and sessions from the affected segment and a control segment.
Look for missing feedback, repeated taps, confusing state, slow or failed requests, crashes, ANRs, and the user’s recovery attempts.
The map says where the experience diverged. Replay says what the divergence felt like.
Handle cross-session journeys carefully
Some outcomes span sessions. A user starts setup, asks a teammate for credentials, returns the next day, and activates. A subscriber sees a renewal failure, updates the method from email, and returns later.
Define identity and time windows before stitching sessions. Preserve session boundaries so intentional waiting is not mistaken for one long stalled interaction. Respect consent and privacy requirements, and avoid joining behavior across users or devices without a legitimate, documented identity model.
For team accounts, distinguish the account journey from an individual user journey. One person may start a task and another may complete it.
Avoid the prettiest-path trap
Journey visualizations can become compelling and uninformative. A readable map that hides the long tail may overstate how orderly the product is; a complete map may be impossible to interpret.
Use aggregation rules transparently: show the highest-volume paths; preserve a labeled long-tail bucket; allow filters for errors, outcomes, releases, and cohorts; keep node and edge counts visible; and let users open the sessions behind a branch.
Do not remove a low-volume path simply because it is visually inconvenient. A small route with a crash or payment contradiction may deserve more attention than a broad healthy path.
Use journey analytics for release review
Before a release, save the important cohort and path definition. After release, compare: new branches; changed transition shares; increased loops or time between states; error and stability signals on the path; and goal completion and downstream retention.
This can reveal a behavioral regression before the top-line funnel moves enough to trigger concern.
Turn the map into one product decision
A useful journey review ends with a statement such as:
Invited users who open upgrade are routed to billing settings they cannot access, then loop between pricing and the workspace. Owners do not show the same path.
The statement identifies the population, anchor, divergent path, and comparison. The team can now change role-aware routing or messaging and verify whether the loop and failed outcome decline.
“Users take many paths” is true and not actionable.
Move from the journey map to the session
Rejourney uses the journey map as an index into real sessions. Select a path, isolate the branch where users loop or leave, and open the recordings that created it. A healthy session from the same cohort provides the comparison that a map alone cannot.
For revenue-critical paths, the same cohort can feed a revenue leak investigation.
When the journey includes a measurable goal, continue in Rejourney's funnel analysis with replay evidence. Use web session replay or mobile app session replay to inspect the experience behind the path.