
What changed with Smartlook?
Smartlook carved out a strong niche by sitting at the intersection of qualitative UX research and product analytics. It allowed teams to watch session recordings, view heatmaps, track custom events, and build funnels across both web and mobile apps.
However, Cisco’s acquisition of Smartlook in 2023 shifted its direction. Cisco integrated the technology into Cisco AppDynamics to bolster its full-stack observability suite. Consequently, Cisco's official migration path points toward Splunk Observability Cloud (specifically RUM + Digital Experience Analytics).
While Splunk is a powerful choice for enterprise infrastructure and SRE teams, it is not necessarily the right fit for product managers, UX researchers, support leads, or mobile developers who relied on Smartlook as an intuitive, daily workspace to diagnose friction. If your main objective is understanding user behavior rather than managing enterprise observability, you will need to look elsewhere.
The unique challenge of migrating session replay tools
When you migrate a database or a CRM, you can usually export your data and import it into the new system. Replay tools are different.
Session recordings are not video files; they are complex reconstructions of DOM modifications, network requests, console errors, and device orientation changes. Mobile replay adds native runtime gestures and screen rendering details to the mix. Because there is no universal file format for session recordings, you cannot port your Smartlook history into a competitor's database.
As a result, migration requires a parallel setup phase:
- Treat your legacy data as an archive: Plan for your old recordings to remain in Smartlook until your access is sunset.
- Start early: Integrate your new behavior analytics tool weeks or months before the Smartlook deadline so you have active user cohorts and search history ready before you lose access to the old system.
Start with your actual debugging workflow
Rather than comparing checkboxes on feature grids, evaluate how your team actually investigates product issues. A typical debugging workflow usually follows these steps:
- A funnel drop-off, support ticket, or crash alert points to a problem.
- The team opens the relevant user sessions to see what went wrong.
- Heatmaps indicate whether users are missing a call-to-action or clicking non-interactive elements.
- Journey maps show the paths users took before and after the friction point.
- Technical context (network requests, console errors, or native crashes) reveals whether the issue was a design flaw or a code bug.
If your replacement tool only offers basic video playback, you will waste hours stitching together the rest of the story. The ideal alternative should keep behavior metrics and technical diagnostics in the same workspace.
Replay as the anchor of team investigation
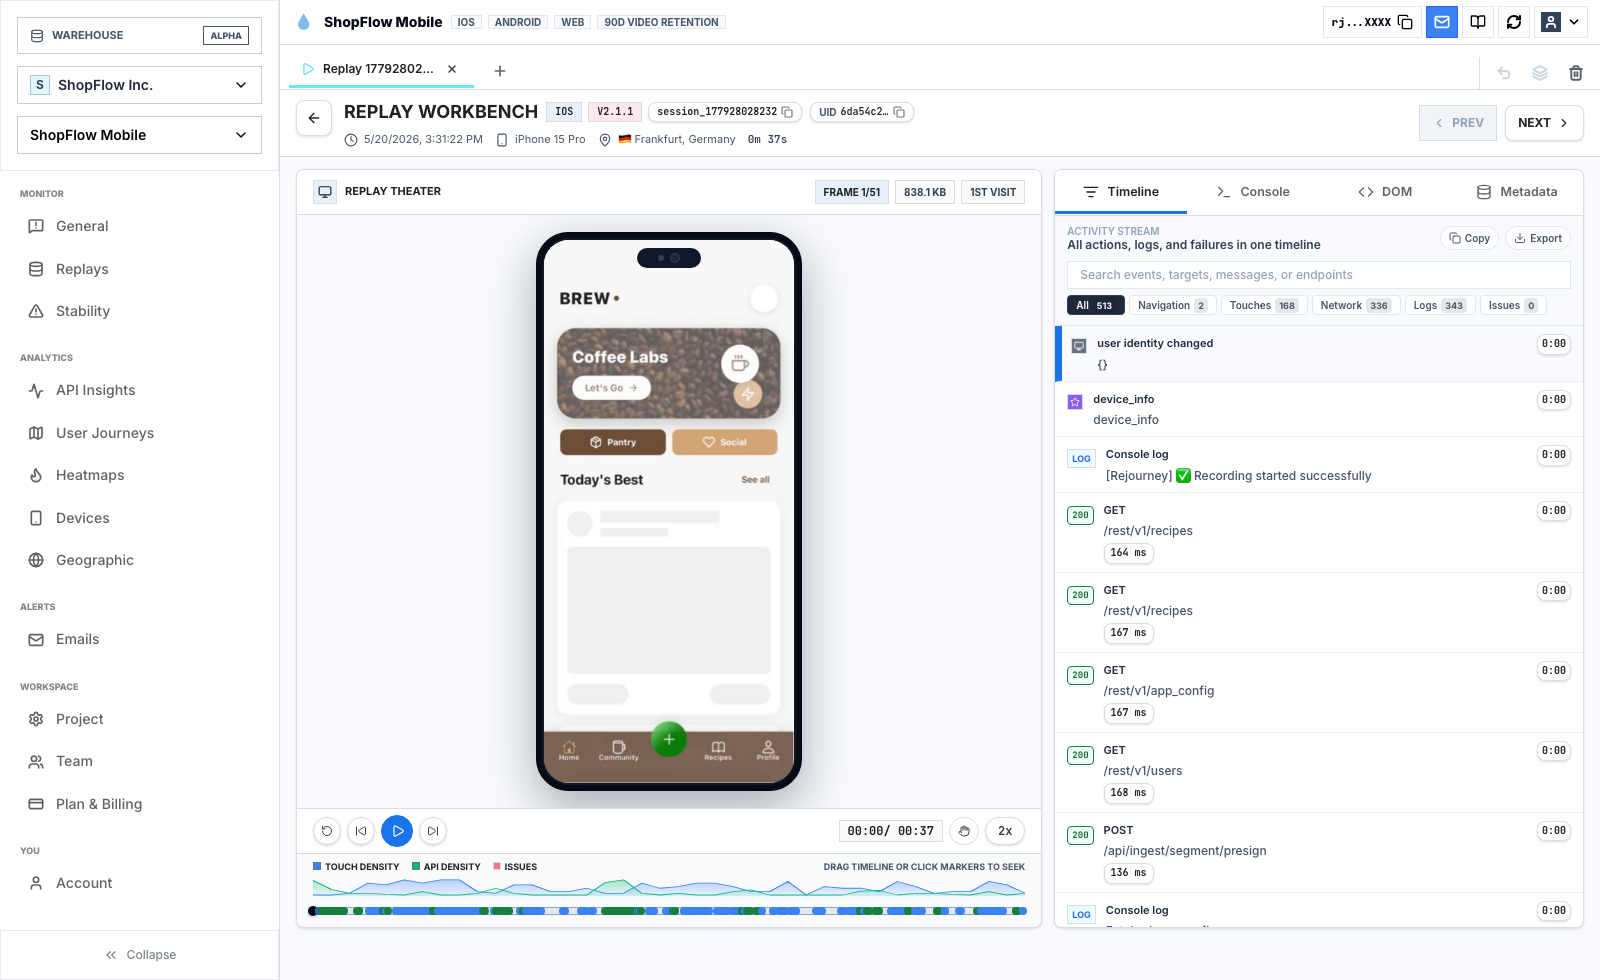
When evaluating alternatives, test the session player thoroughly. It should serve as the source of truth for both your support and engineering teams.
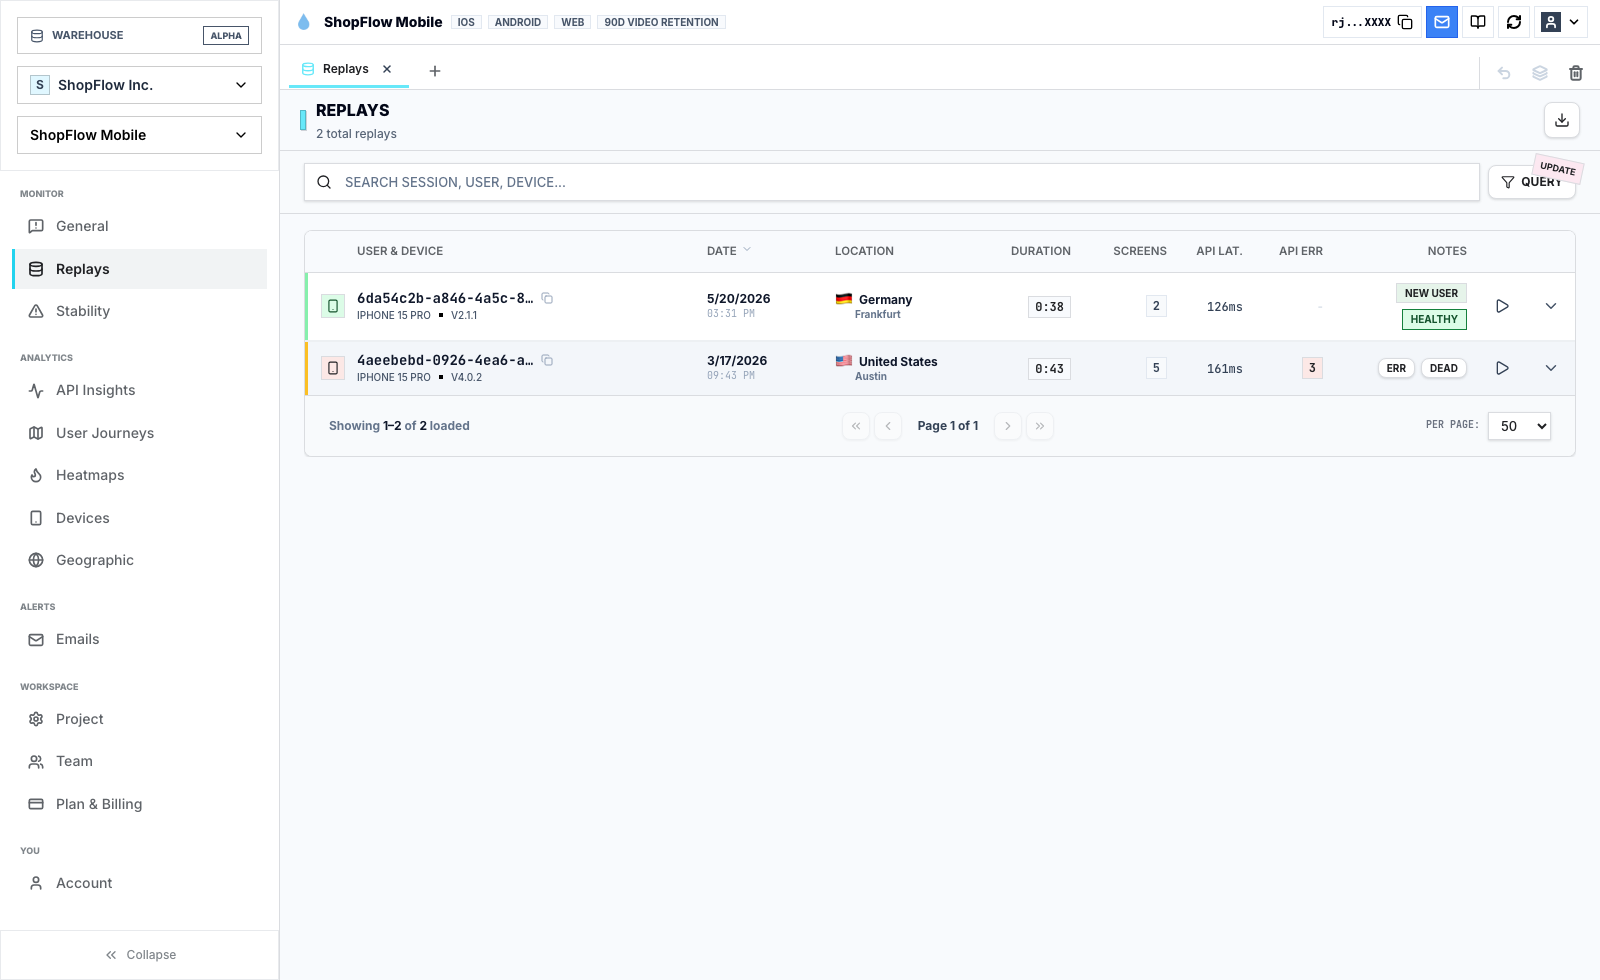
- Can support find the right session? Support agents need to jump directly from a user identifier or ticket ID to the exact session that caused the complaint.
- Can engineers diagnose the root cause? The replay interface should display network payloads, console warnings, app version tags, and CPU/memory activity side-by-side with the playback.
- Can product managers filter by friction signals? You should be able to filter sessions by rage clicks, dead clicks, API errors, and screen performance regressions.
Connecting heatmaps to user journeys
While heatmaps show where clicks and taps cluster, they do not explain why users clicked there. A hotspot on a page could mean intense user interest, or it could mean users are repeatedly tapping a broken, non-responsive element.
To bridge this gap, your alternative must tie heatmaps to the sessions that generated them.
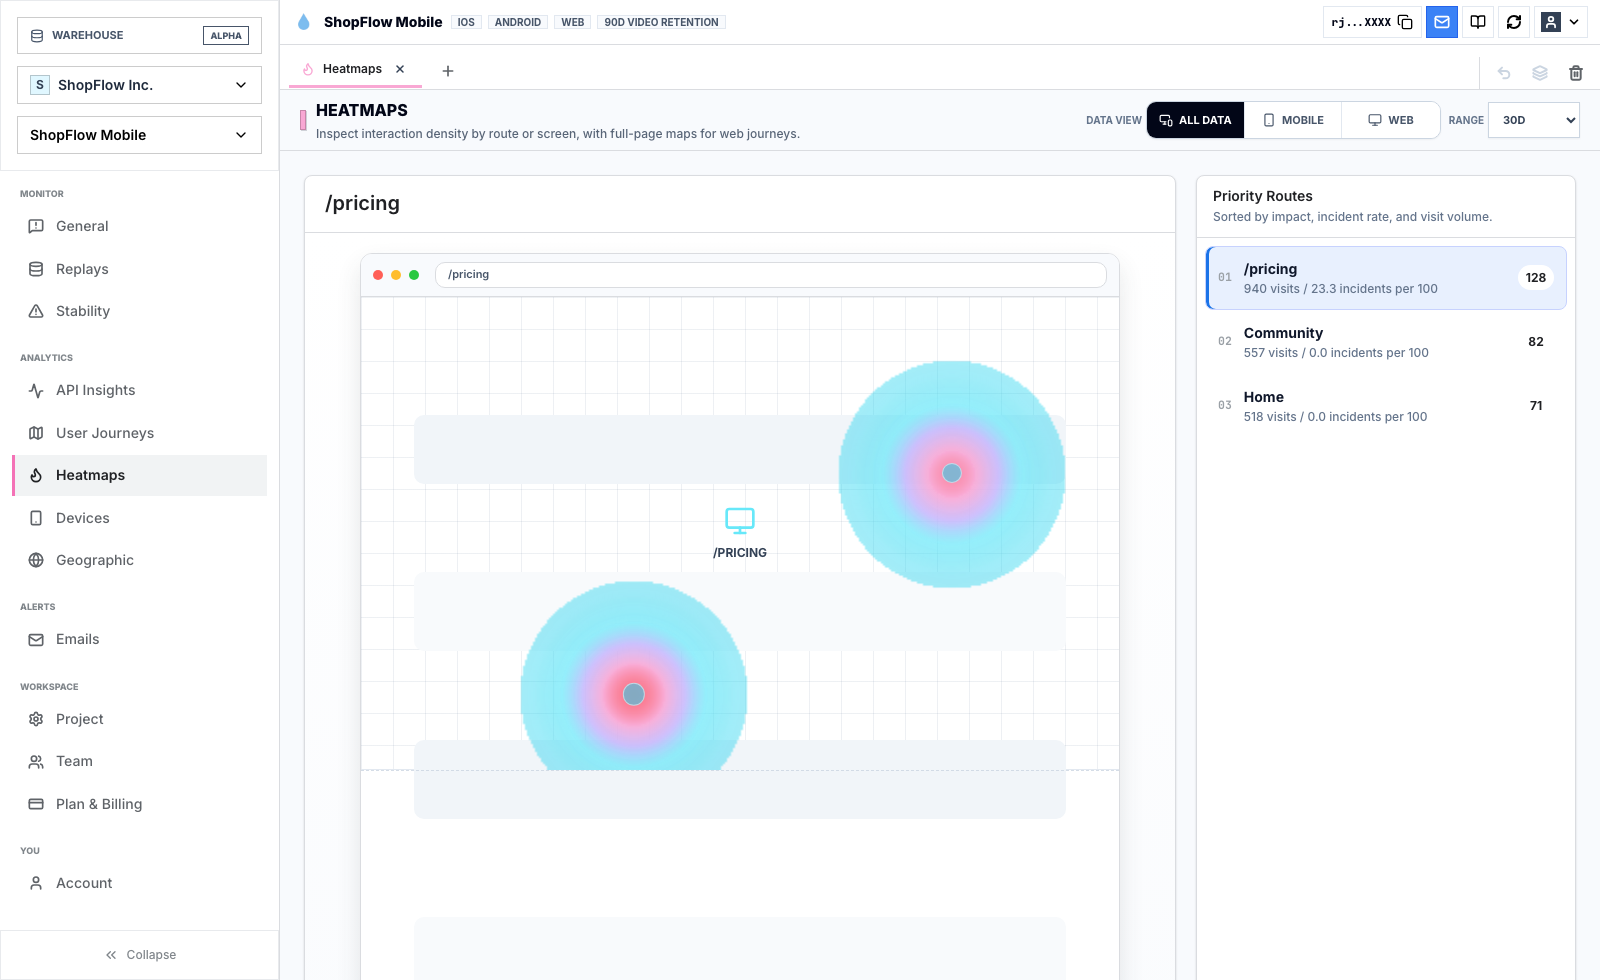
When reviewing a heatmap, you should be able to click any hotspot to open the exact sessions that contributed to that cluster. This helps you distinguish between healthy engagement and frustrated clicks.
Evaluating mobile session replay
If you support iOS, Android, or React Native apps, mobile session replay should be a primary evaluation factor. Mobile apps present unique challenges that web-focused tools cannot handle well:
- Gesture Tracking: You need to see swipes, multi-taps, pinch-to-zoom actions, and device rotations.
- System Events: Replays must capture system alerts, keyboard interactions, and application state transitions (like backgrounding and resuming).
- Stability Metrics: The tool must capture Application Not Responding (ANR) events and native crashes, linking them to the user behavior leading up to the failure.
Connecting analytics to replay evidence
Quantitative dashboards tell you what is happening (e.g., "signup conversion fell by 15%"), but qualitative replays show you why it's happening.
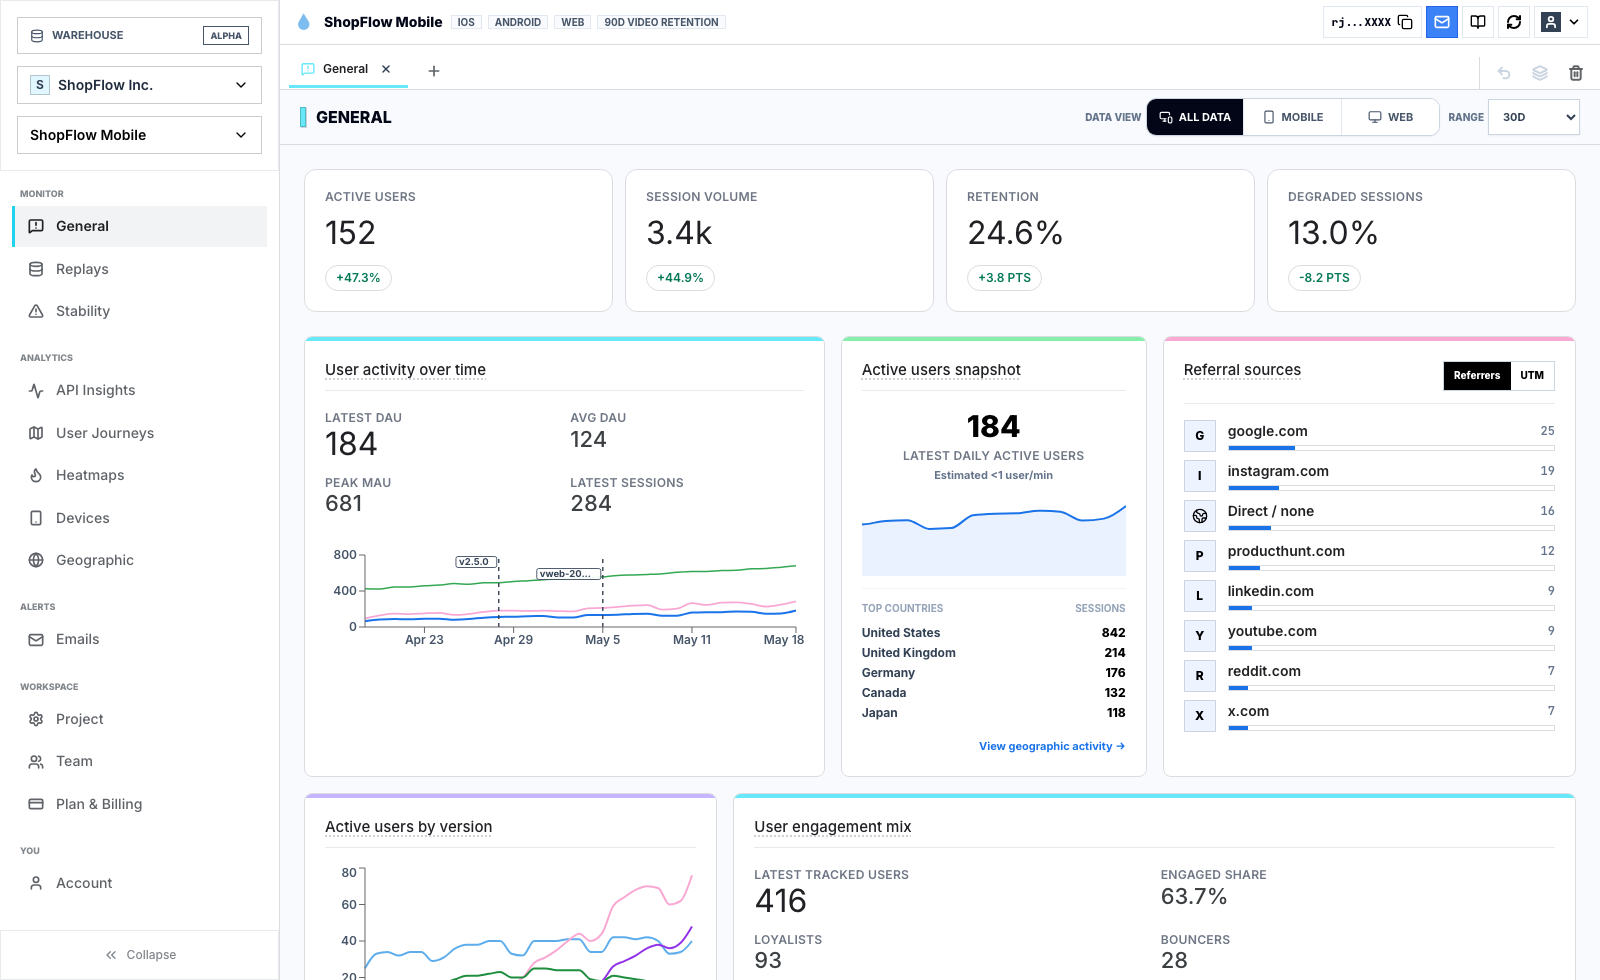
Choose a platform that makes it seamless to jump from a drop-off in a funnel chart to the recordings of the users who dropped off at that specific step.
The importance of technical context
UX friction is often a symptom of technical failure. If a user abandons a checkout page, they might have disliked the shipping price, or they might have hit a silent JS exception or a slow API request that made the payment button unresponsive.
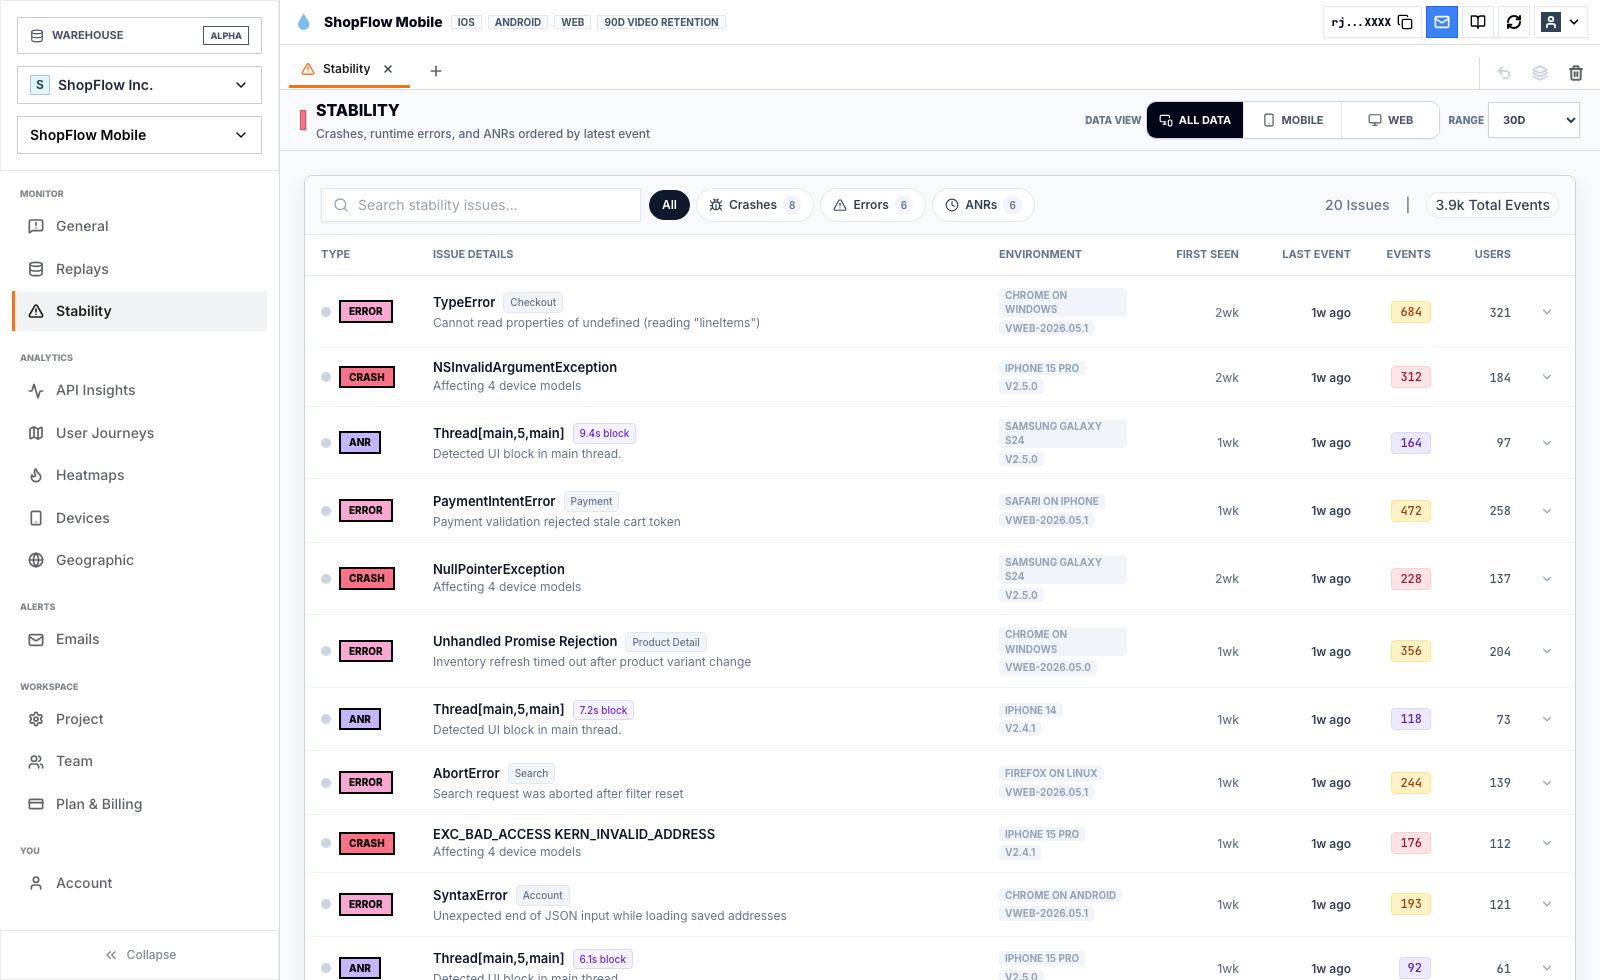
By embedding console logs, network latencies, and error stack traces directly into the session player, you enable product and engineering teams to diagnose issues in minutes rather than spending days passing tickets back and forth.
A practical migration checklist
Before committing to a new behavior analytics provider, run through this checklist:
| Migration Checklist | What to Verify |
|---|---|
| Workflow parity | Does the tool offer recordings, heatmaps, funnels, and custom event tracking? |
| Mobile support | Does it support native iOS/Android, React Native, or Expo SDKs with gesture capturing? |
| Searchability | Can you search and filter sessions by user ID, custom events, device type, and errors? |
| Data transition | Can you run the new tool in parallel with Smartlook to build up user history? |
| Cross-team collaboration | Can you easily share session links with support, product, and engineering? |
| Technical details | Does it show console logs, network payloads, and crash stacks beside the video? |
Where Rejourney fits
Rejourney is designed as a direct Smartlook alternative for product-led teams that want to keep replay-backed analytics at the center of their workflow.
Instead of migrating to a massive, expensive enterprise observability suite, Rejourney provides a focused workspace:
- Web and Mobile Replay: Native support for web, React Native, Expo, and iOS.
- Connected Heatmaps: Click any cluster to watch the corresponding sessions.
- Combined Diagnostics: View network requests, console errors, crashes, and ANR details directly inside the session player.
- Flat Pricing: Predictable pricing options that allow you to invite your entire team and track events without worrying about sudden quota overages.
If you are looking for a detailed vendor comparison, check out Rejourney vs Smartlook.
Sources used for product transition details: Cisco Smartlook end-of-sale and end-of-life announcement, Cisco Smartlook acquisition page, and Smartlook pricing page.