Read the practical answer first, then inspect the product without creating an account.
5,000 sessions free·No credit card·GDPR compliant
Lightweight SDKs/Privacy masking/Hosted in Germany
The short answer
The right signal depends on the question
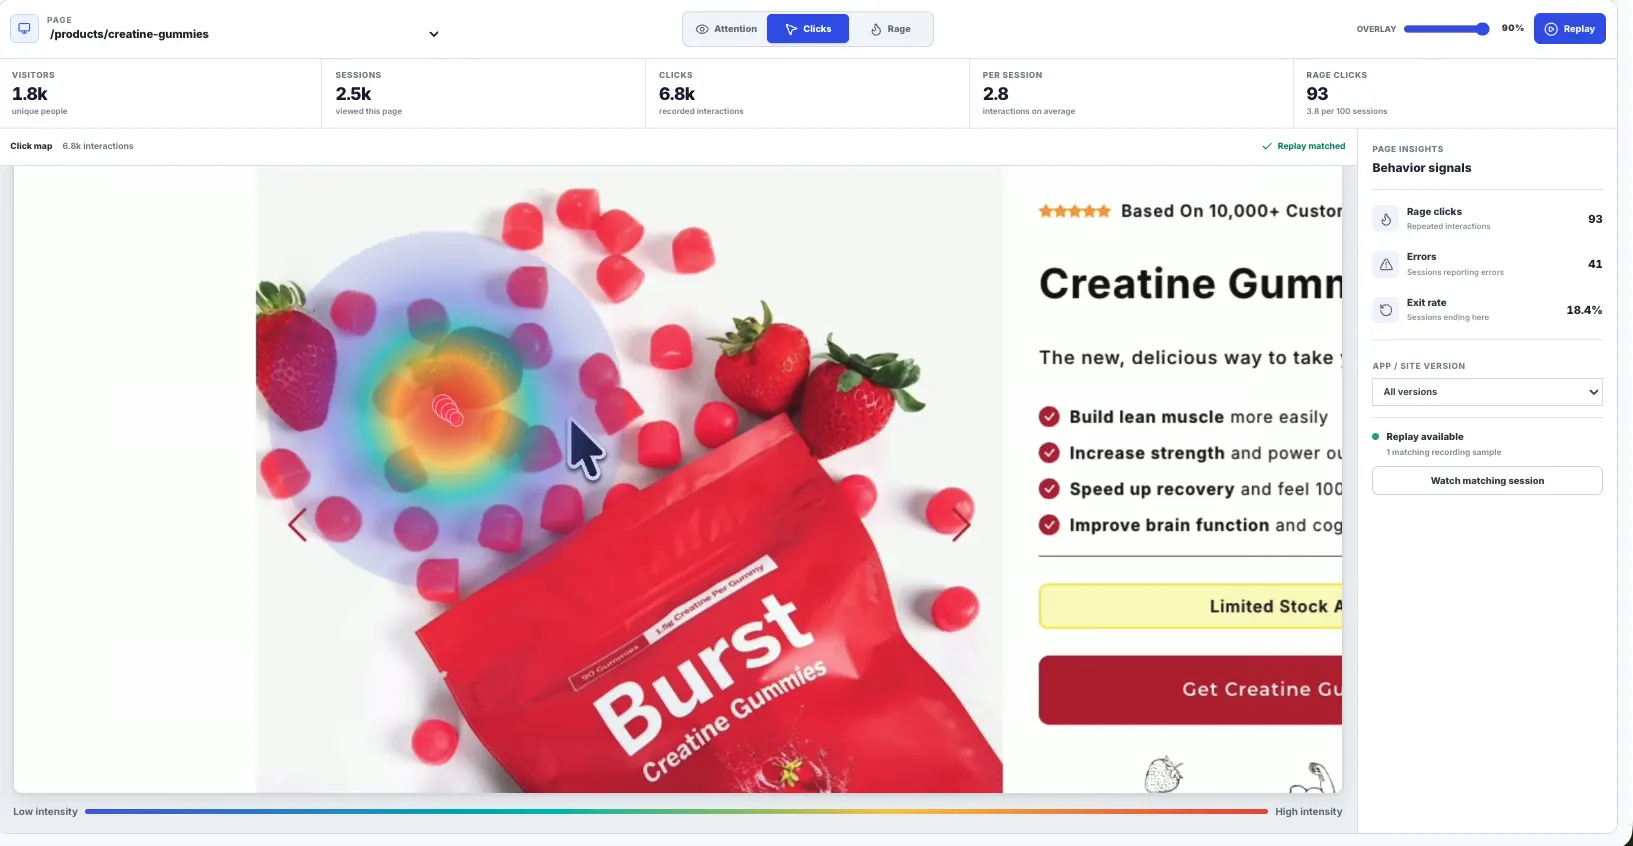
Seeing what users do starts with choosing the right observation layer. Replay shows the individual session, journeys show repeated paths, heatmaps show attention or repeated interaction, events show sequence, and errors or requests show where the system changed the experience.
The mistake is opening everything at once. Start with a bounded question, such as users who reached checkout but did not pay, users who retried search, or accounts on a new release that hit a slow endpoint.
Rejourney combines those layers so a team can move from 'users are dropping' to 'this route, interaction, request, and release window explain the drop.'
You want replay, product analytics, heatmaps, journeys, crashes, and network context together.
You need predictable pricing with unlimited events, retention, projects, and team members.
You want a lightweight SDK that is easy to add to web, React Native, Expo, Flutter, and iOS apps.
You want a product team and engineering team to investigate the same real session.
From idea to evidence
The right signal depends on the question
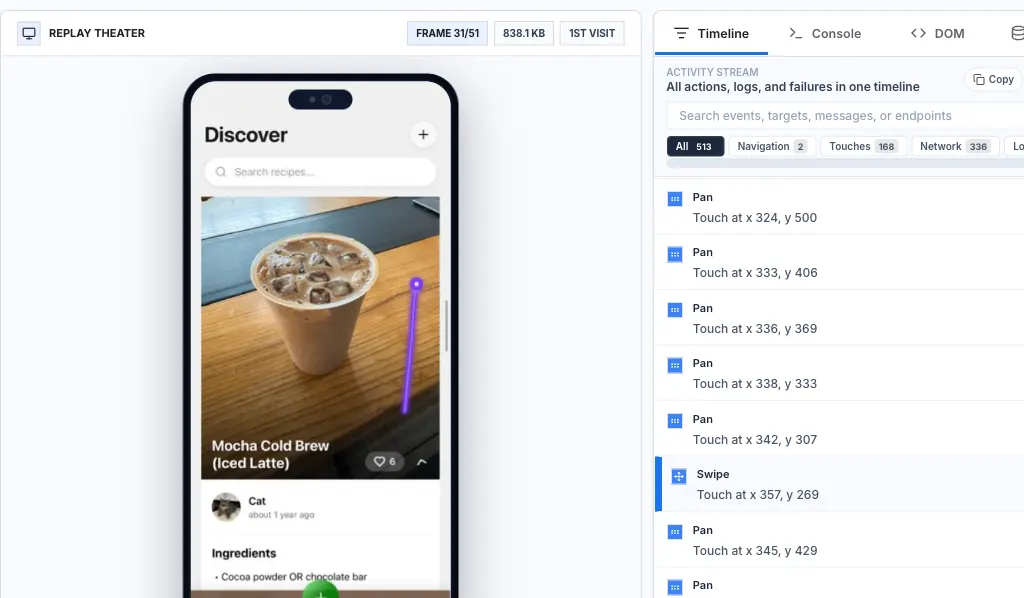
1. Watch sessions
Watch sessions
Seeing what users do starts with choosing the right observation layer. Replay shows the individual session, journeys show repeated paths, heatmaps show attention or repeated interaction, events show sequence, and errors or requests show where the system changed the experience.
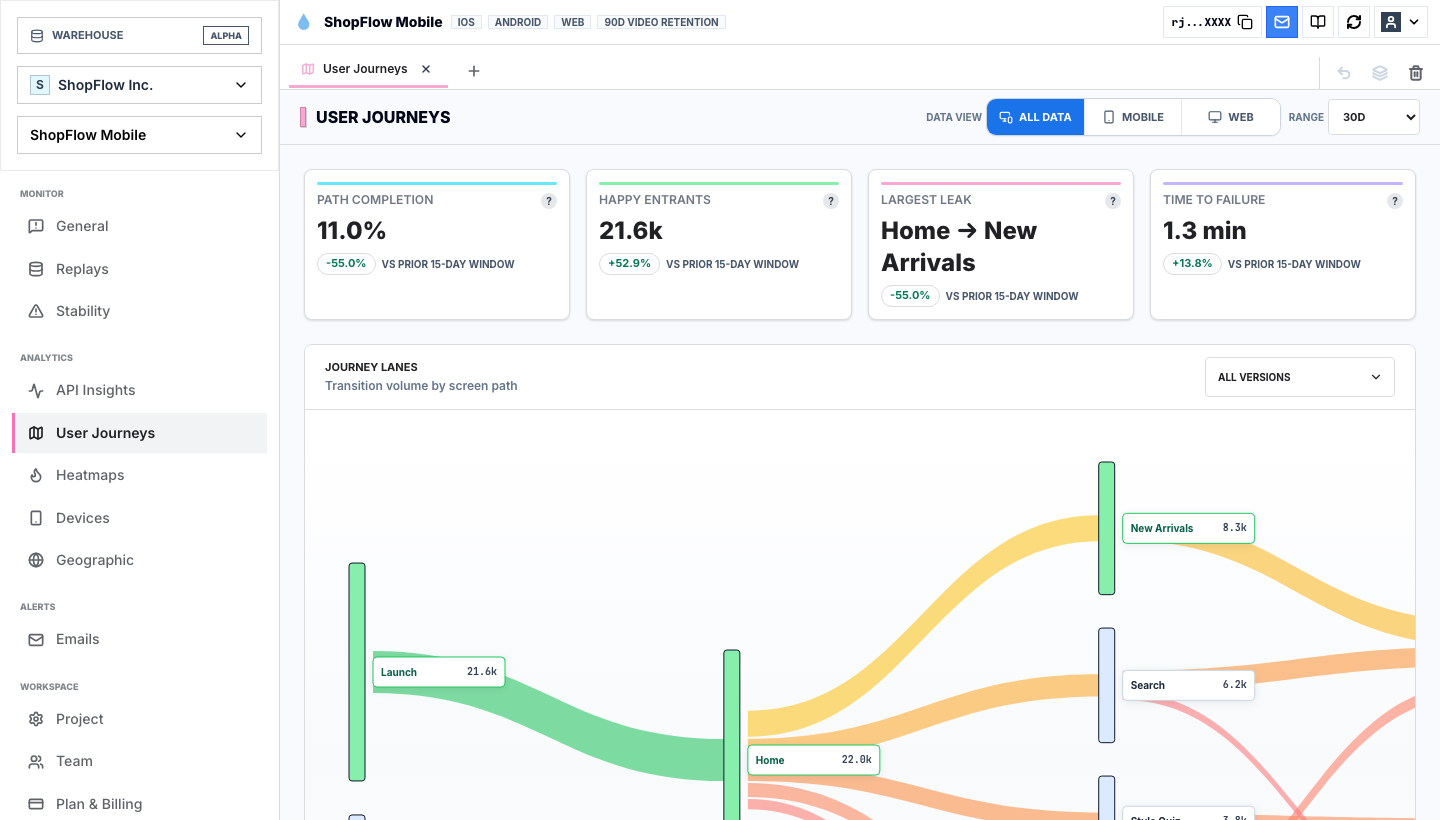
2. Map journeys
Map journeys
The mistake is opening everything at once. Start with a bounded question, such as users who reached checkout but did not pay, users who retried search, or accounts on a new release that hit a slow endpoint.
3. Find friction
Find friction
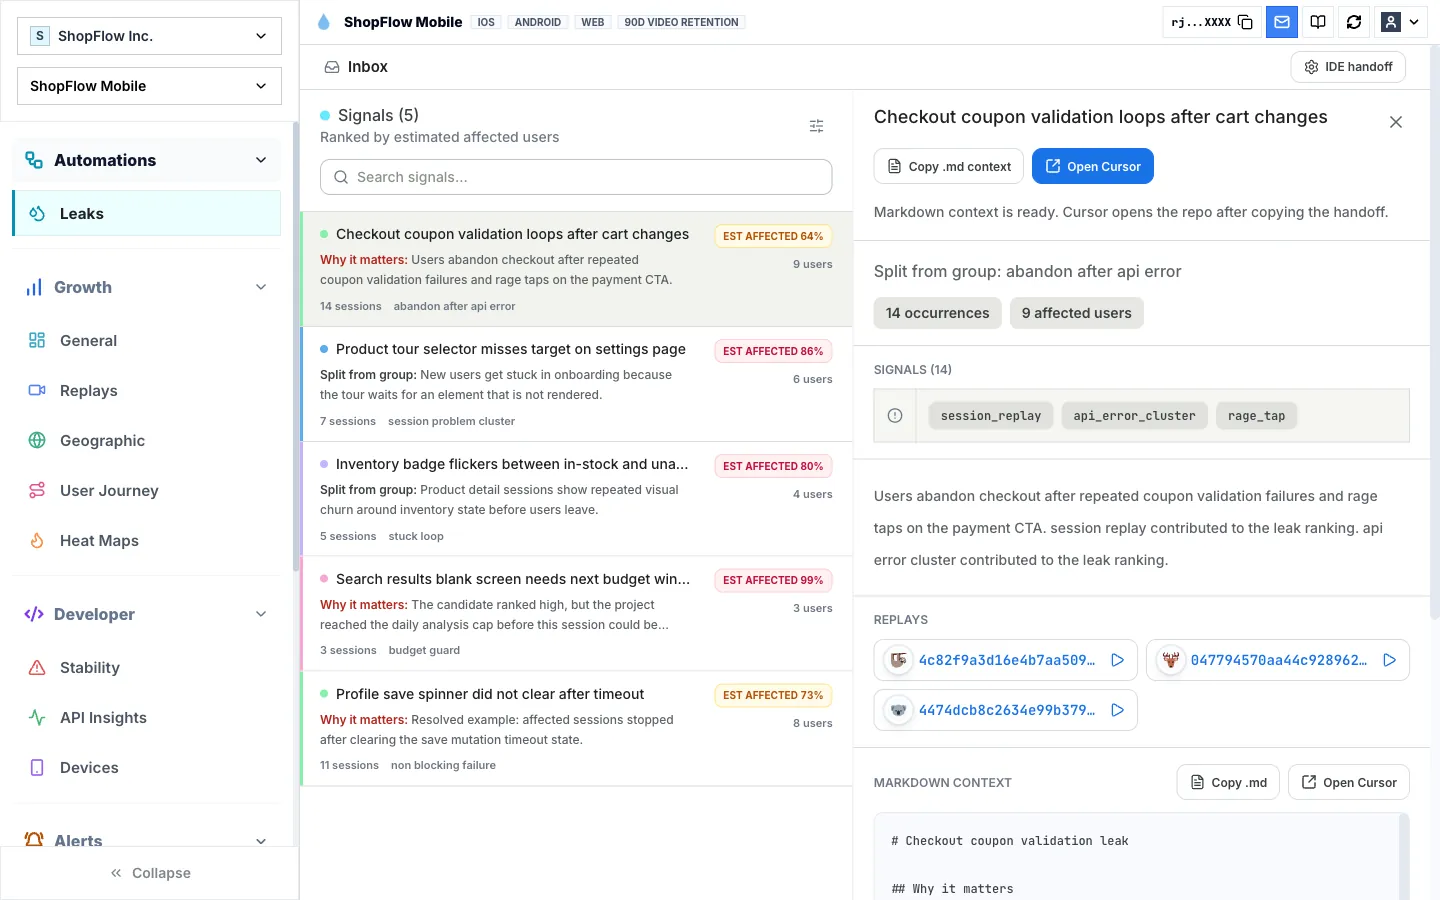
Rejourney combines those layers so a team can move from 'users are dropping' to 'this route, interaction, request, and release window explain the drop.'
Use session replay to watch real sessions, then combine it with events, heatmaps, journeys, crashes, and network context to understand the behavior.
Is this useful for websites and mobile apps?
Yes. Rejourney supports browser replay and mobile replay workflows, so teams can inspect behavior across web, Flutter, React Native, Expo, and native iOS apps.
How do I avoid cherry-picking one replay?
Use replay as the starting point, then look for repeated patterns with journeys, heatmaps, events, and analytics so one session becomes evidence in context.
Start with a real product
Turn product behavior into an answer.
Start free with 5,000 monthly sessions, unlimited analytics events, and no credit card.