
Hotjar has long been a popular choice for marketing sites and landing pages. Its visual heatmaps, simple session recordings, and quick feedback widgets are excellent for verifying that a page layout is working or gathering quick user feedback.
However, as a product matures into a dynamic web application or a native mobile app, teams often run into the limits of what a simple visual tracking tool can provide.
A heatmap can show you that users are clicking a non-interactive image, and a recording can show one user getting confused on a form. But to fix product friction efficiently, your team needs to know:
- Does this issue affect a significant segment of our users, or is it a rare edge case?
- Is this conversion drop-off specific to a particular app version or device?
- Did a network request fail or a console error fire during this session?
- Can our engineering team replicate the bug from the technical context?
For product and development teams, the best alternative is a workflow that connects visual user behavior with actual technical telemetry.
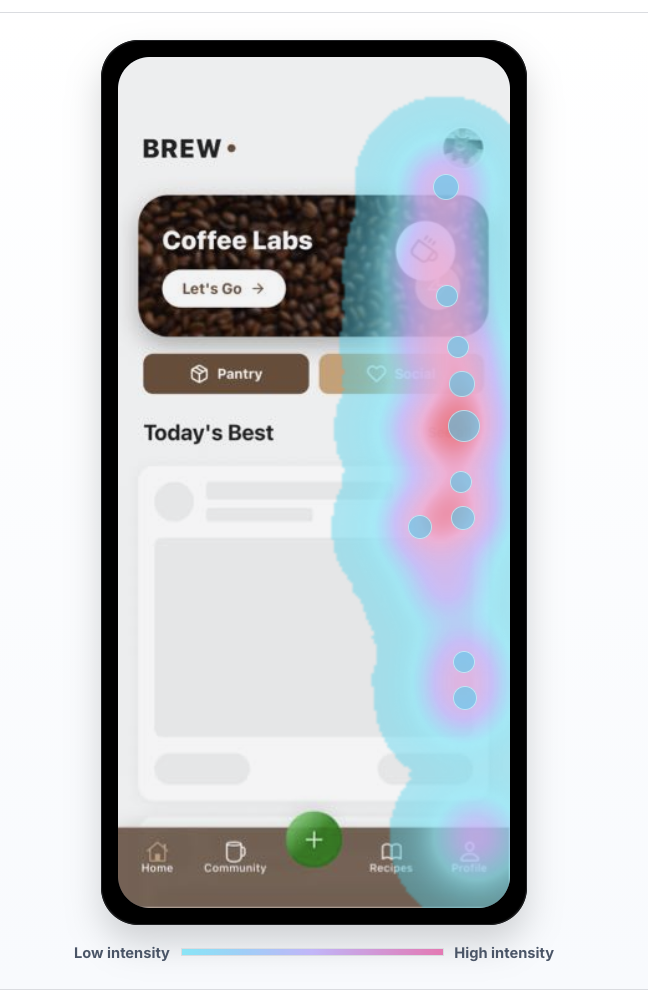
Where traditional heatmaps fall short
Heatmaps are great at compressing thousands of clicks into a single visual summary. They make it easy to see if a call-to-action is being ignored or if users are scrolling past vital content.
However, heatmaps only show what occurred, not why it occurred. A high-density hotspot on a button could mean:
- High user interest.
- User confusion.
- Users click a disabled element that gives no feedback.
- A slow network request made users tap multiple times out of frustration.
To understand the context behind a hotspot, you need to be able to click directly on that section of the heatmap and watch the individual sessions of the users who clicked there.
Contextualizing session recordings
Session recordings provide the qualitative detail that dashboards lack. Watching a user navigate your interface can reveal friction points that metric charts hide.
But watching random replays can also lead to misprioritizing edge cases. If a team watches five random videos, they might fix a minor visual bug while missing a major conversion leak. The key is to start with your quantitative data—like a drop-off in a funnel—and then open the session replays of the specific users who dropped off at that step.
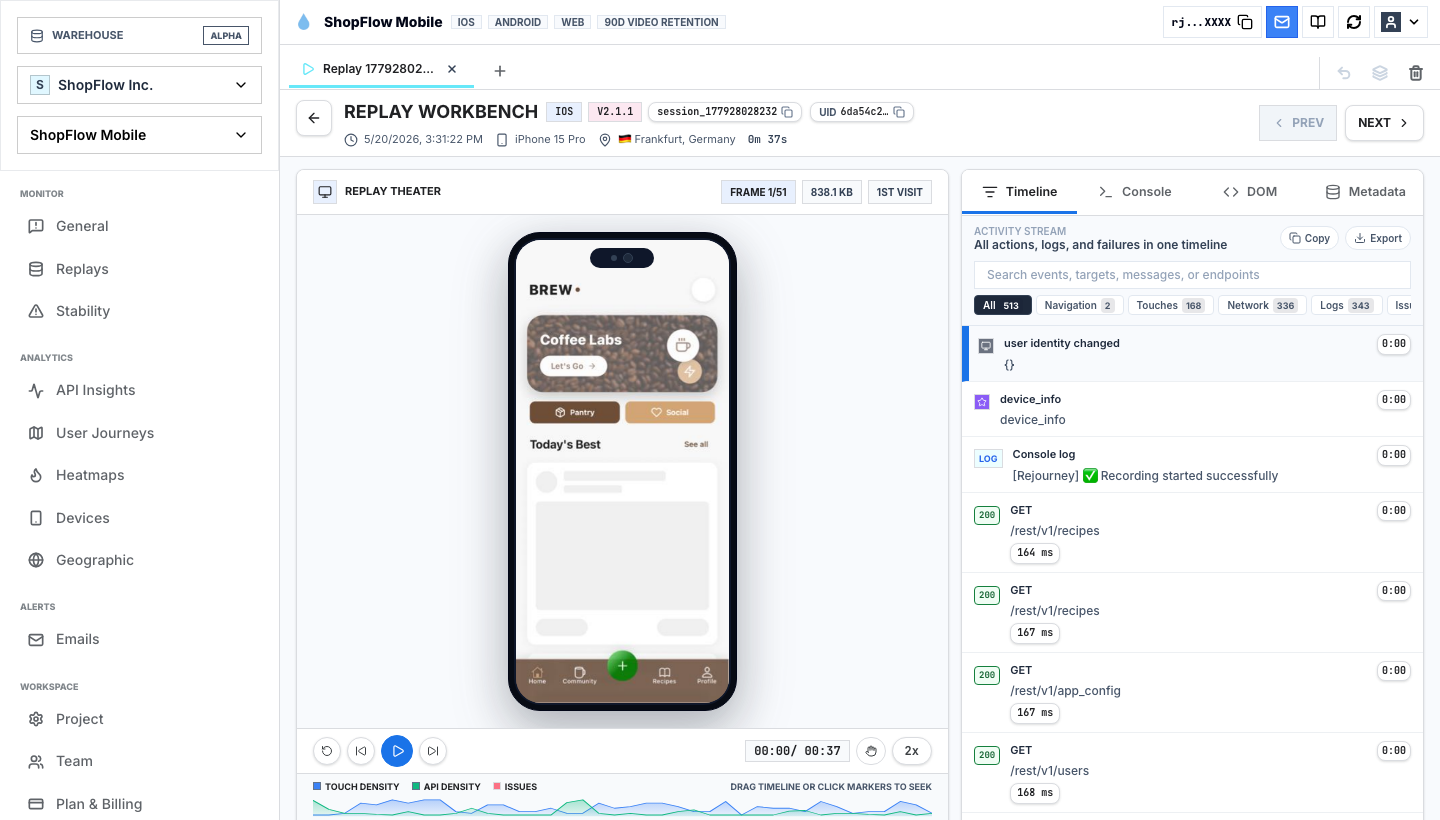
When you watch a replay, you should also have access to the developer console logs, network latencies, and device status events side-by-side with the video player. This ensures that when product managers find a bug, engineers have the data they need to fix it.
Connecting replays to user journeys
While individual sessions tell a story, user journeys show the overall pattern.
Many simple heatmap tools offer limited user journey mapping. For product teams, understanding the path is critical. You need to see if users are looping back and forth between search and product details, or if they are bouncing off a checkout screen because of shipping costs.
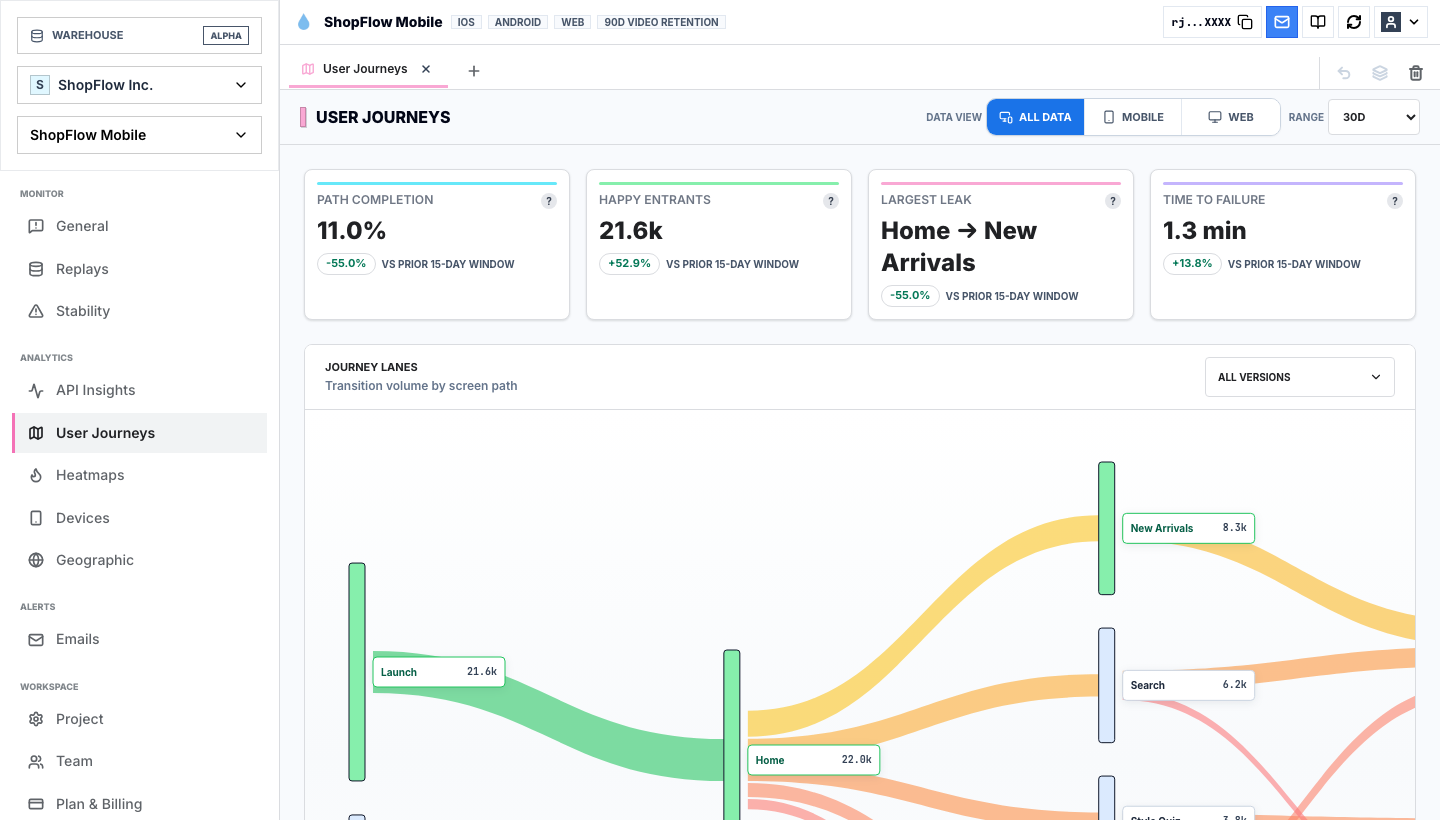
Journey analytics allow you to track user flows at scale, helping you decide where to focus your product improvements.
Segmenting your behavior data
A good behavioral analytics tool should help you filter and segment your user sessions by multiple dimensions:
- New vs. returning users.
- Traffic and acquisition source.
- Device type, browser, OS, and app version.
- Specific friction signals like rage clicks, dead clicks, or network failures.
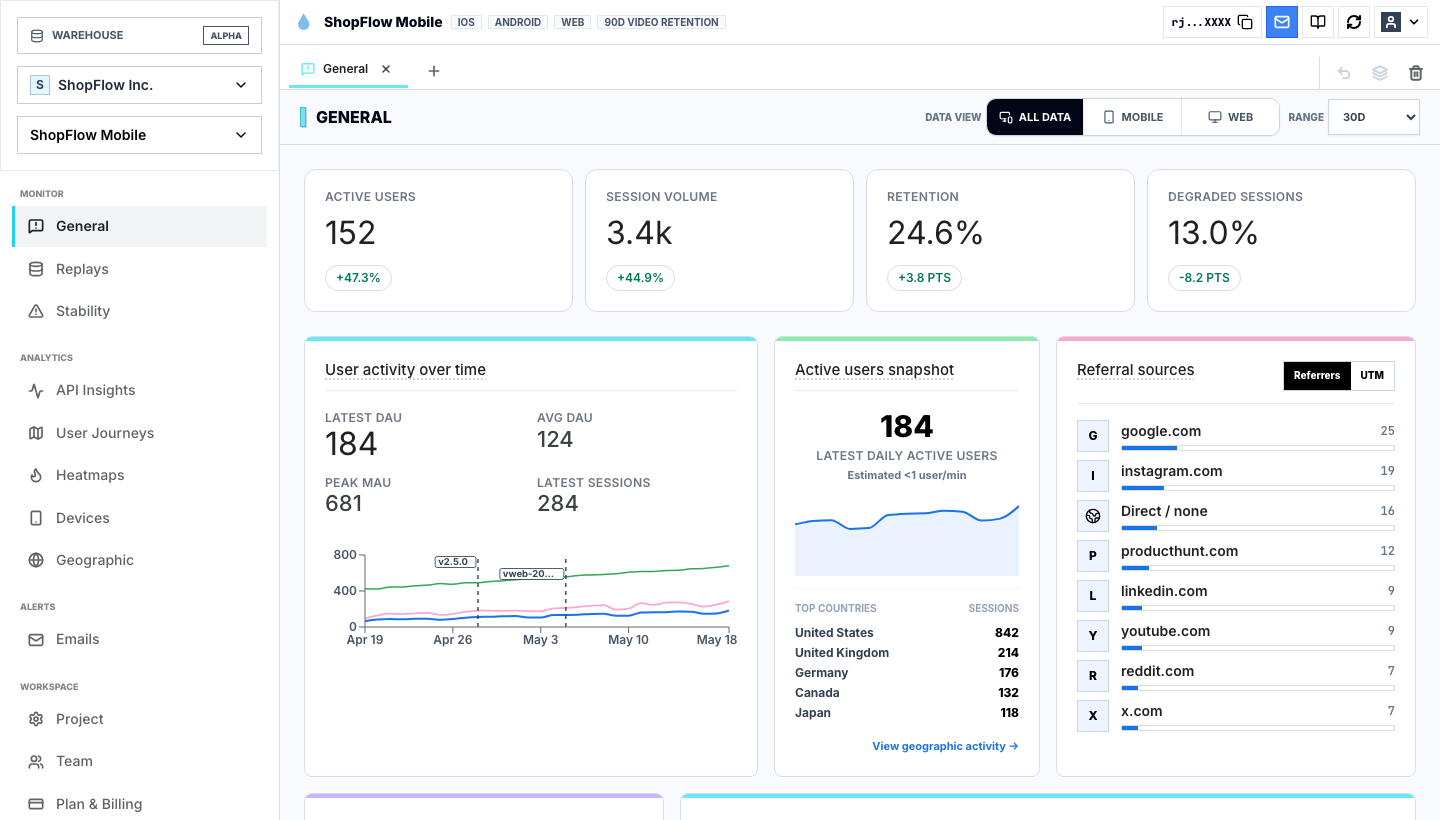
Without detailed filtering, you risk spending time optimizing features for small user cohorts while neglecting the issues that impact your core customer base.
The mobile app gap
One of the most significant reasons teams seek Hotjar alternatives is mobile app support.
Hotjar is primarily designed for web interfaces. If your product has a native iOS, Android, or React Native app, you will need a tool that can capture mobile-specific interactions:
- Taps, swipes, pinch gestures, and device rotations.
- Native mobile crashes and Application Not Responding (ANR) events.
- Device models, memory status, and network quality indicators.
Mobile UX friction is often technical. A drop-off during mobile onboarding is frequently caused by a device-specific crash or an API timeout rather than a design issue.
Technical telemetry in UX debugging
Users do not distinguish between a design flaw and a technical bug; to them, the product just feels broken.
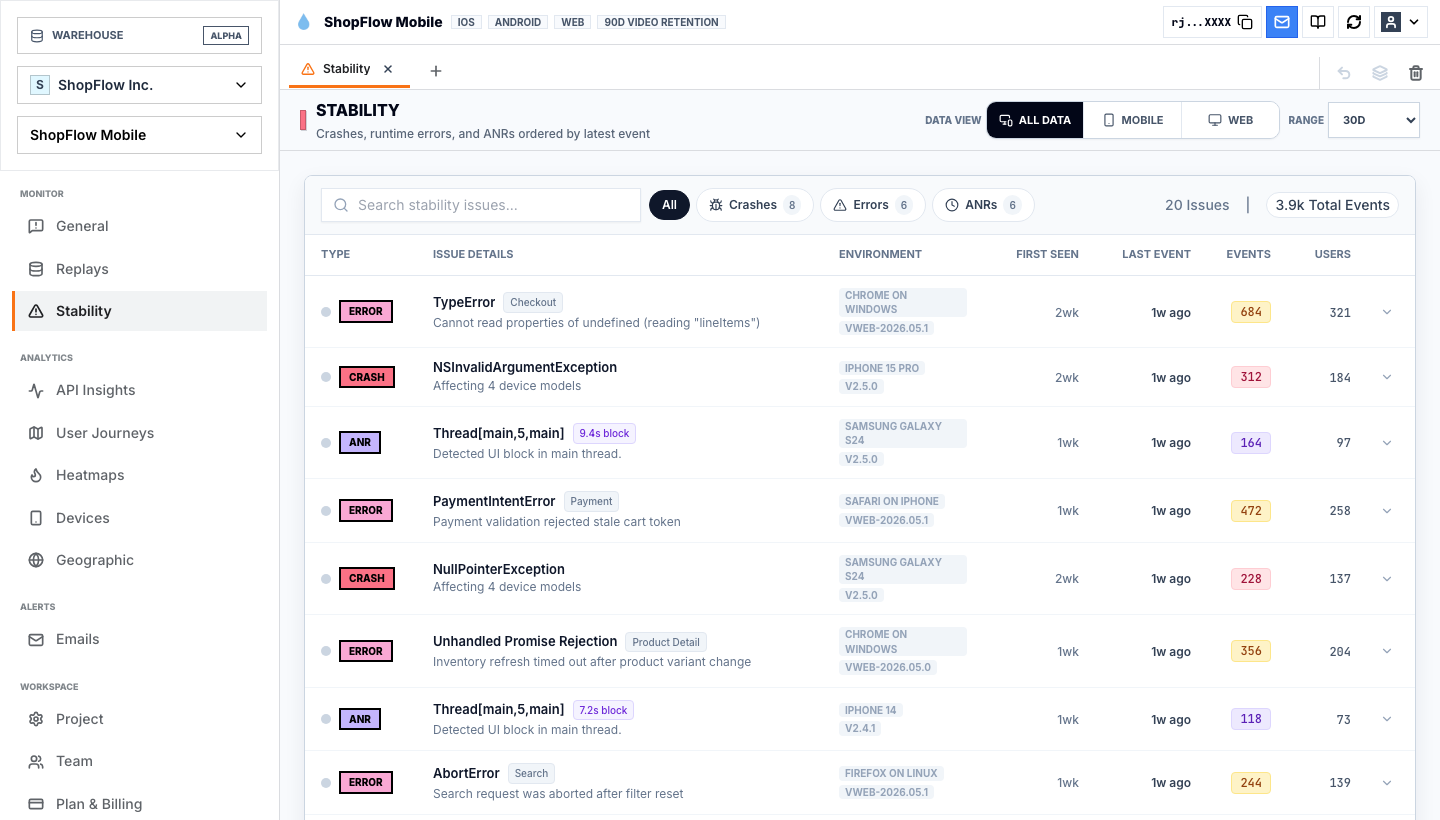
If a payment page fails, a product manager needs to know if the copy was confusing, or if the billing API returned a 500 error. When your behavior analytics and technical diagnostic logs reside in the same session player, you eliminate the guesswork and speed up resolution times.
Checklist for choosing a Hotjar alternative
When comparing alternatives, keep these criteria in mind:
| Feature | What to Evaluate |
|---|---|
| All-in-one timeline | Does it display clicks, console errors, and API requests together? |
| Heatmap integration | Can you click on a heatmap hotspot to watch the matching sessions? |
| Journey mapping | Can you visualize the path users take before and after a drop-off? |
| Mobile capabilities | Does it support native mobile platforms with gesture tracking? |
| Predictable pricing | Does it offer simple pricing that permits team-wide collaboration? |
Where Rejourney fits
Rejourney is built for product teams that want to connect visual behavior tracking with deep technical insights.
It provides:
- Web and Mobile Replay: Full support across web, React Native, Expo, and native iOS apps.
- Heatmaps Tied to Replays: Jump directly from a visual click cluster to the actual user session recordings.
- Journeys and Funnels: Analyze user flows at scale and see the replays behind the drop-offs.
- Developer Telemetry: Inspect network payloads, console warning logs, and native crashes next to playback.
- Flat Pricing: Inviting your whole team is included, with unlimited seats and projects.
If you want a direct vendor comparison, see Rejourney vs Hotjar.
Sources used for Hotjar details: Hotjar pricing and Hotjar plans docs.